
.
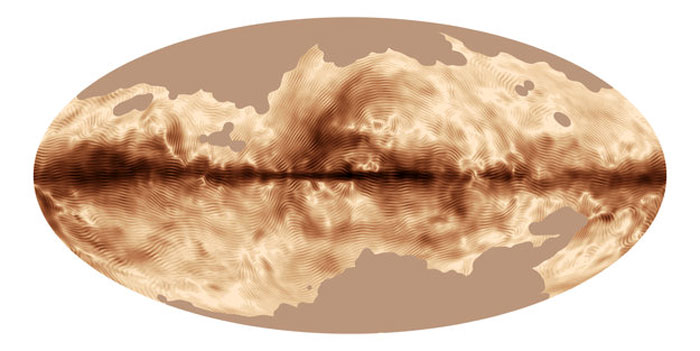
The magnetic field of our Milky Way Galaxy as seen by ESA’s Planck satellite. This image was compiled from the first all-sky observations of polarised light emitted by interstellar dust in the Milky Way. The magnetic field is displayed using a visualisation technique called line integral convolution (LIC).
Darker regions correspond to stronger polarised emission, and the striations indicate the direction of the magnetic field projected on the plane of the sky. The dark band running horizontally across the centre corresponds to the Galactic Plane. Here, the polarisation reveals a regular pattern on large angular scales, which is due to the magnetic field lines being predominantly parallel to the plane of the Milky Way. The data also reveal variations of the polarisation direction within nearby clouds of gas and dust. This can be seen in the tangled features above and below the plane, where the local magnetic field is particularly disorganised.
The image is a Mollweide projection of the full celestial sphere, with the plane of the Galaxy aligned with the horizontal axis of the oval. Certain areas in the image, mostly at high Galactic latitude, have been masked out. The overall intensity in these regions is low, complicating the separation of foreground and CMB components. Further data analysis will improve this by the time of the full data release in late 2014.
.
Our Galaxy’s magnetic field is revealed in a new image from ESA’s Planck satellite. This image was compiled from the first all-sky observations of ‘polarised’ light emitted by interstellar dust in the Milky Way.
Light is a very familiar form of energy and yet some of its properties are all but hidden to everyday human experience. One of these – polarisation – carries a wealth of information about what happened along a light ray’s path, and can be exploited by astronomers.
Light can be described as a series of waves of electric and magnetic fields that vibrate in directions that are at right angles to each other and to their direction of travel.
Usually, these fields can vibrate at all orientations. However, if they happen to vibrate preferentially in certain directions, we say the light is ‘polarised’. This can happen, for example, when light bounces off a reflective surface like a mirror or the sea. Special filters can be used to absorb this polarised light, which is how polarised sunglasses eliminate glare.
In space, the light emitted by stars, gas and dust can also be polarised in various ways. By measuring the amount of polarisation in this light, astronomers can study the physical processes that caused the polarisation.
In particular, polarisation may reveal the existence and properties of magnetic fields in the medium light has travelled through.
The map presented here was obtained using detectors on Planck that acted as the astronomical equivalent of polarised sunglasses. Swirls, loops and arches in this new image trace the structure of the magnetic field in our home galaxy, the Milky Way.
In addition to its hundreds of billions of stars, our Galaxy is filled with a mixture of gas and dust, the raw material from which stars are born. Even though the tiny dust grains are very cold, they do emit light but at very long wavelengths – from the infrared to the microwave domain. If the grains are not symmetrical, more of that light comes out vibrating parallel to the longest axis of the grain, making the light polarised.
If the orientations of a whole cloud of dust grains were random, no net polarisation would be seen. However, cosmic dust grains are almost always spinning rapidly, tens of millions of times per second, due to collisions with photons and rapidly moving atoms.
Then, because interstellar clouds in the Milky Way are threaded by magnetic fields, the spinning dust grains become aligned preferentially with their long axis perpendicular to the direction of the magnetic field. As a result, there is a net polarisation in the emitted light, which can then be measured.
.
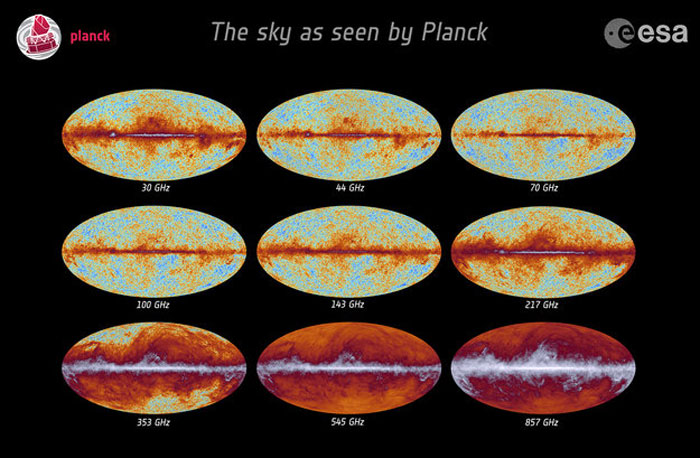
This image shows the all-sky maps recorded by Planck at nine frequencies during its first 15.5 months of observations. These were collected using the two instruments on board Planck: the Low Frequency Instrument (LFI), which probes the frequency bands between 30 and 70 GHz, and the High Frequency Instrument (HFI), which probes the frequency bands between 100 and 857 GHz.
The Cosmic Microwave Background is most evident in the frequency bands between 70 and 217 GHz. Observations at the lowest frequencies are "polluted" by foreground radio emission from the interstellar material in the Milky Way, which is mostly due to synchrotron radiation emitted by electrons that spiral along the lines of the Galactic magnetic field. It also comprises bremsstrahlung radiation, emitted by electrons that are slowed down in the presence of protons, as well as emission from spinning dust grains. Observations at the highest frequencies are influenced by foreground emission from interstellar dust in the Milky Way.
The combination of data collected at all of Planck's nine frequencies is crucial to achieve an optimal reconstruction of the foreground signals, in order to subtract them and reveal the underlying Cosmic Microwave Background.
.
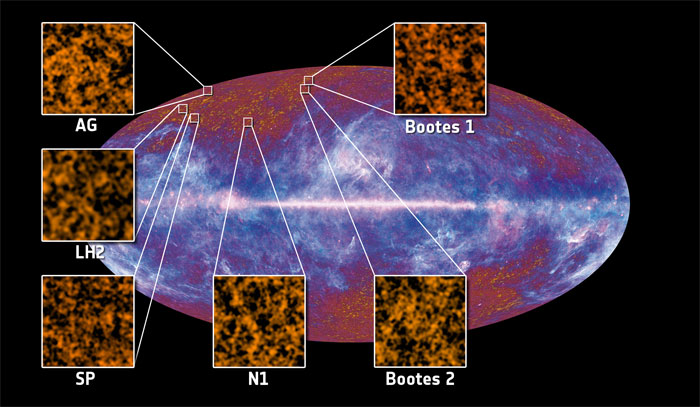
This image shows the location of the first six fields used to detect and study the Cosmic Infrared Background. The fields, named N1, AG, SP, LH2, Boötes 1 and Boötes 2, respectively, are all located at a relatively high galactic latitude, where the foreground contamination due to the Milky Way's diffuse emission is less dramatic.
Quelle: ESA
5918 Views