12.08.2019


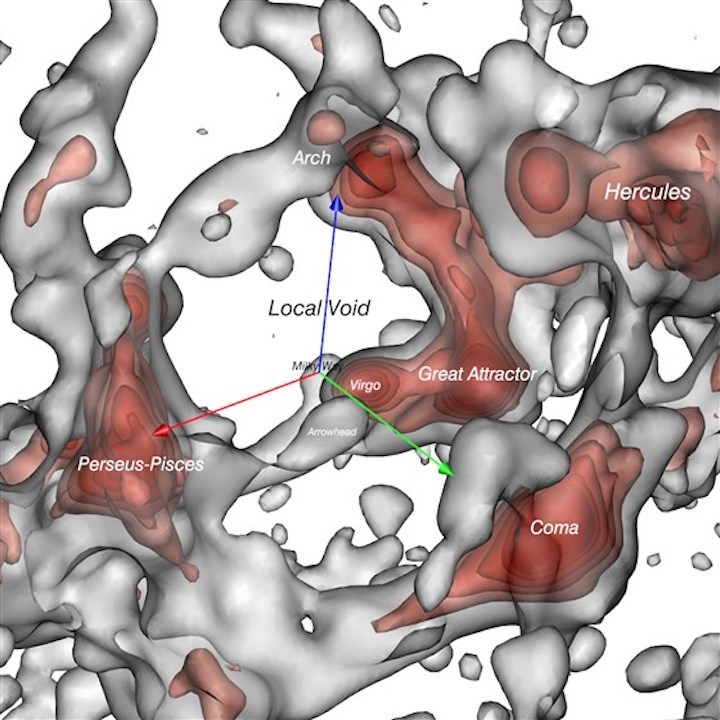
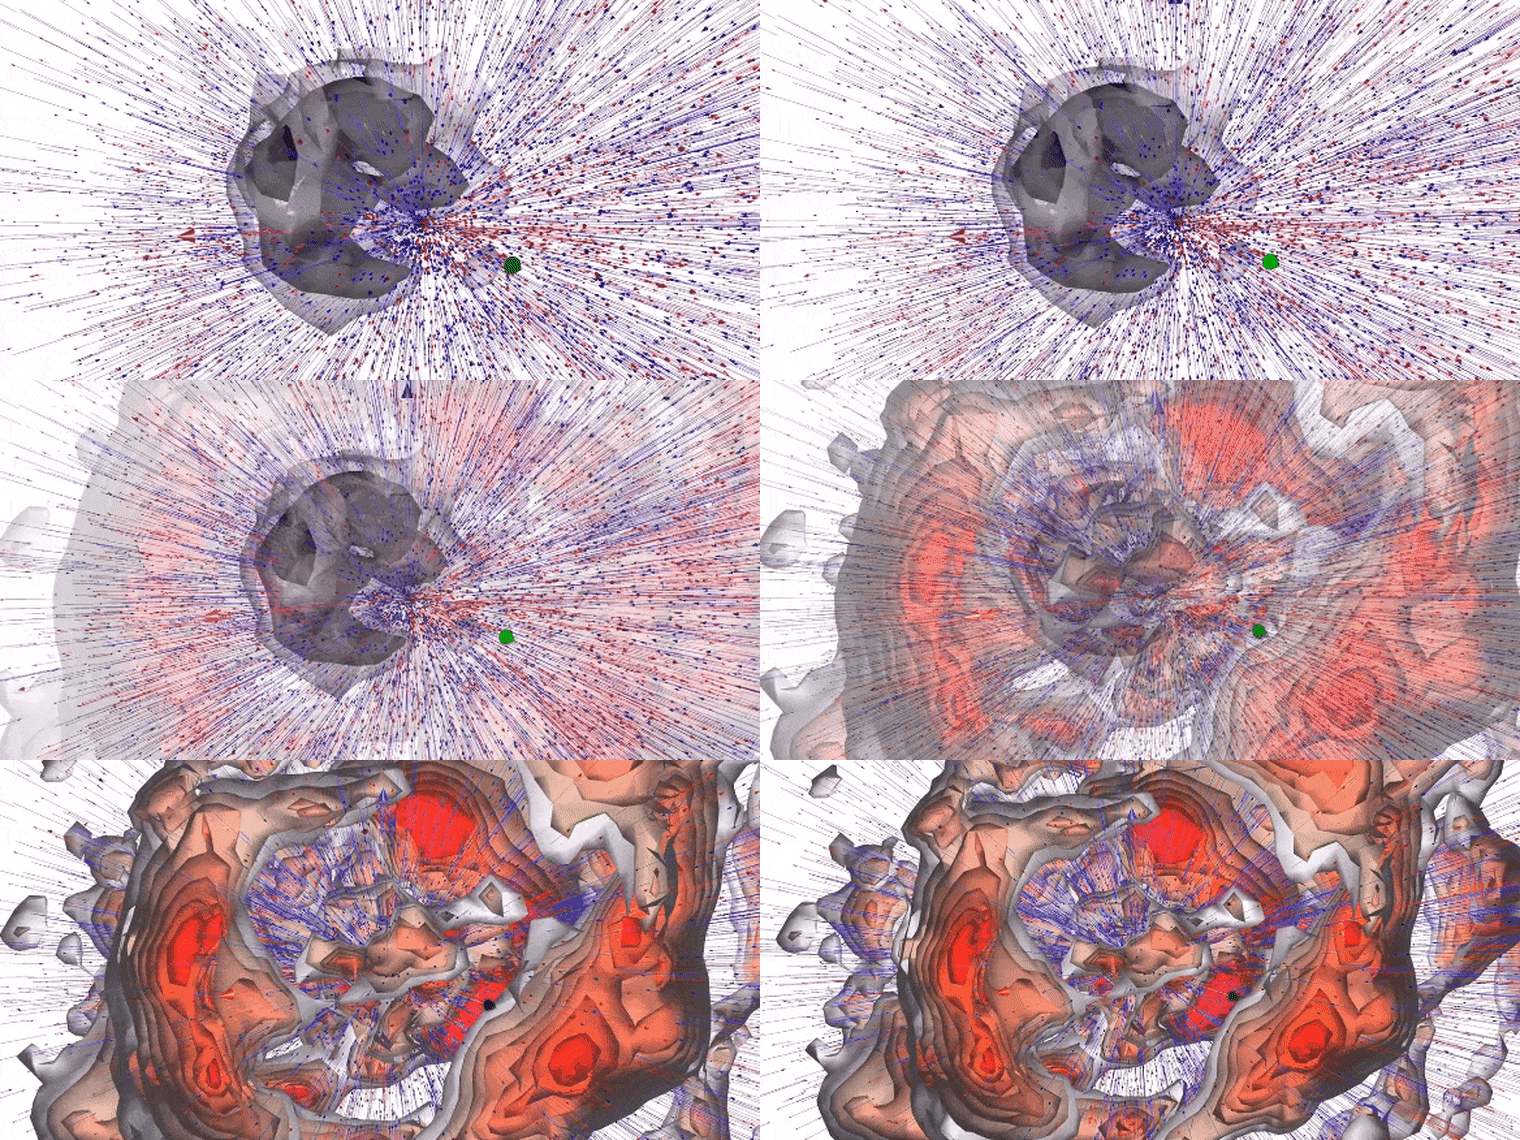
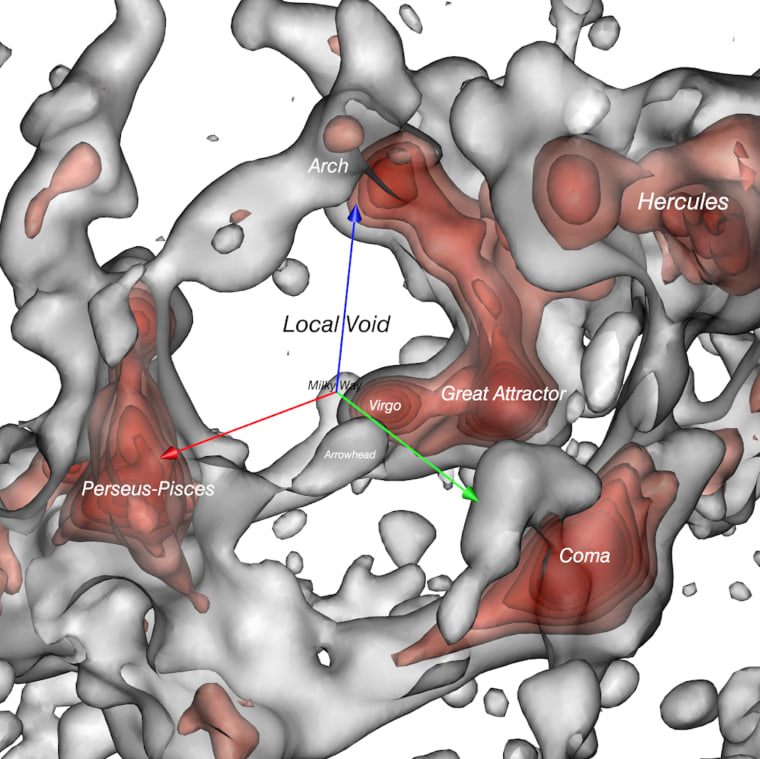
In this brief view, red regions indicate the locations of dense galaxy clusters, which have been growing and evolving since the Big Bang. Lines show how individual galaxies move in response to the pull from those clusters, essentially flowing "downhill" to the places where gravity is strongest. The gray shape is the Local Void, where there is comparatively little matter.
Brent Tully knows where you live and where you’re going — in the cosmic sense, that is.
At the University of Hawaii’s Institute for Astronomy in Honolulu, the veteran cosmologist has been meticulously charting the large-scale structure of the universe. In July, after more than three decades of work, he and his collaborators released the latest fruits of this labor: the most complete view ever created of our place in space.
In these vivid 3D maps, which Tully calls “Cosmicflows,” the universe takes on a startlingly new appearance. You won’t find our solar system or any familiar stars. You won’t even find our home galaxy, the Milky Way. The scale is so vast that entire galaxies shrink to dots, blend together and vanish into the bigger picture, like pixels on a computer screen.
What pops out at the end is nothing less than the master plan of the universe, seen across nearly a billion light-years. It contains a physical record of everything that has happened in our part of the universe since the time of the Big Bang.
For all its intricacies, the master plan has just four basic elements. “You can break down the universe into clusters, filaments, sheets and voids,” Tully says. Clusters, filaments and sheets are the dense regions where galaxies are common. The names describe their shapes: knot-like clusters of galaxies, string-like filaments and pancake-like sheets.
Voids are the comparatively empty places between these structures. What they lack in heft, the voids make up in space, accounting for most of the volume of the universe. Voids also strongly influence the movement of galaxies around them, so the maps show not only where matter exists in the universe but also how and where it’s moving.
Under the force of gravity, the maps show, galaxies tend to move toward the dense clusters. Daniel Pomarède at the University of Paris-Saclay, the master cartographer in Tully’s group, likens this process to the flow of rivers into ocean basins. By plotting these motions for many thousands of galaxies, the researchers have managed to uncover hidden currents running across hundreds of millions of light-years.
“We can create 3D visualizations of streamlines of galaxies, and we see them converging on different ‘basins’ of attraction,” Pomarède says. Every person on Earth is part of one of those majestic flows. We just didn’t know it until now.
From the local to the astronomical
It’s all a bit much to take in, so Tully breaks down our cosmic location step by step. He begins with the “you-are-here” spot, invisibly small at the center of the Cosmicflows map: the Milky Way, a rotating spiral galaxy 100,000 light-years wide with a mass of one trillion suns — including our own.
And that’s just the first dot in the picture.
Next is the Local Group, a gathering of about 50 galaxies that includes another large spiral, the Andromeda Galaxy. The whole gathering is about three million light-years wide. “Everything within that volume is collapsing,” Tully says, with Andromeda destined to collide with our Milky Way in about 4 billion years.

Around the Local Group are other small clusters of galaxies spanning about 30 million light-years. Collectively, they lie within a flattened structure called the Local Sheet. Pull back farther still, and the Local Sheet turns out to be just a small patch on the wall of the much larger Local Void.
Within the Local Sheet, we’re also being tugged toward even greater gatherings of galaxies. The nearest of these gravitational basins is the Virgo Cluster, about 50 million light-years away. Beyond that is a pile-up of eight galaxy clusters, some 200 million light-years away. Astronomers call it the Great Attractor because of its intense pull on us.
The Great Attractor, in turn, is the center of an even bigger supercluster (a cluster of a cluster of galaxies) that Tully and his colleagues call Laniakea (“immense heaven” in Hawaiian). They discovered it five years ago in the course of their mapping project.
Laniakea encompasses about 100,000 galaxies and spans 500 million light-years. It's the largest structure yet seen — the great galactic ocean basin into which all the local rivers of galaxies are flowing.
The slow path to Laniakea
Piecing together this vast map wasn’t easy. The first clear indications of structure on such enormous scales came in the late 1980s, when astronomer Margaret Geller of the Harvard-Smithsonian Center for Astrophysics co-directed her own cosmic mapping project.
“It unmistakably characterized the walls, filaments and voids,” she says. In particular, her efforts revealed the Great Wall of galaxies, similar in extent to Laniakea but even more distant.
What Geller couldn’t determine was the three-dimensional structure and the dynamic behavior of the structures she was seeing. Tully has been working that side of the problem since 1981, when as a graduate student he tracked down a few thousand previously unknown galaxies using the Green Bank Radio telescope in West Virginia. He, too, began seeing filaments and voids, but on a smaller scale.
At this point, Tully knew what his life’s work would be, though he didn’t know how long it would take. “I just continued it ever since,” he says.
Over the years, his project has expanded into a veritable data factory. Tully and his collaborators make measurements of distant galaxies, gather similar measurements from other teams and process all the information to deduce the motions of objects that, to the human eye, appear frozen in place in the sky. Finally, Pomarède adds his special sauce, the visual interpretation that turns the abstract numbers into intuitive, dynamic maps.
Will the universe pass its tests?
The pretty pictures and videos created by the researchers aren’t just for show. They were crucial for the discovery of Laniakea, Pomarède says, and for the realization that the Milky Way is composed of material dredged out of the Local Void.
Now those visualizations are putting our fundamental understanding of the universe to the test.
Astronomers have developed theoretical models of how the universe should have evolved since the time of the Big Bang, some 13.7 billion years ago. They've then run those models through supercomputer simulations that make precise predictions about what today’s clusters, sheets and filaments should look like.
With Cosmicflows, it’s now possible to compare the models to reality to see if they measure up. So far, “the flows look consistent with expectations,” says Joel Primack, an astrophysicist at the University of California at Santa Cruz.
Tully is less convinced. “What we're seeing in the flow patterns is right up at the high end of what the theory would anticipate,” he says. It’s not a clash, but it’s not the best agreement, either.
To get definitive answers, Tully is working on a new survey that will extend his maps twice as deep into space. Geller is working the problem, too, with a deeper but narrower survey called HectoMAP.
“We're not convinced we've seen the top level of structure and flows. There might be even larger things,” Tully says. If so, the current cosmic models will need modification — maybe a tweak, maybe a complete rethink.
Even then, Cosmicflows will only barely have begun to take in the full extent of the expanse around us. “What we've looked at so far is such a tiny, tiny little piece of the universe,” Tully says. “We are getting deep into terra incognita here.”
Quelle: NBCNews
