.

An amazing time
Making the map of Ganymede was a long and complex task. Some of the scientists behind today’s announcement were graduate students and postdocs at Brown when the Galileo data began to arrive in the 1990s. Credit: U.S. Geological Survey
.
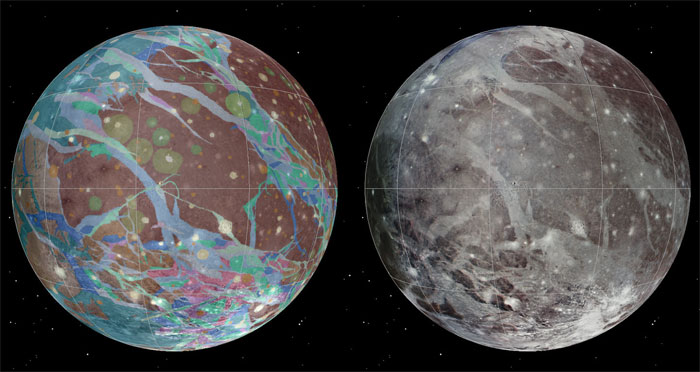
Using images from NASA’s Voyager Mission (1979) and the orbital Galileo Mission (1995), researchers have created the first global geological map of Jupiter’s largest moon, Ganymede.
.
Using images from NASA’s Voyager Mission (1979) and the orbital Galileo Mission (1995), researchers have created the first global geological map of Jupiter’s largest moon, Ganymede.
PROVIDENCE, R.I. [Brown University] — Scientists, including Brown University geologists and students, have completed the first global geological map of Ganymede, Jupiter’s largest moon and the largest in the solar system.
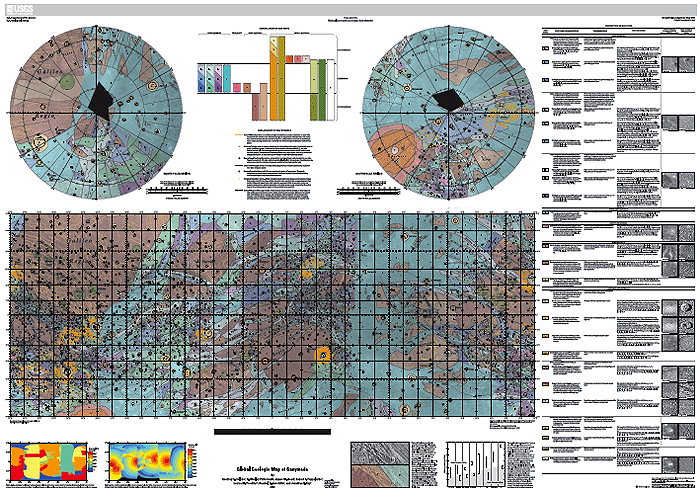
With its varied terrain and possible underground ocean, Ganymede is considered a prime target in the search for habitable environments in the solar system, and the researchers hope this new map will aid in future exploration. The work, led by Geoffrey Collins, a Ph.D. graduate of Brown now a professor at Wheaton College in Massachusetts, took years to complete. The map was published today by the U.S. Geological Survey.
“It is very rewarding to see the results of all of our efforts here at Brown come together into this integrated global compilation that will now be used to plan the next phase of scientific exploration of the Galilean satellites,” said Jim Head, the Scherck Distinguished Professor of Geological Sciences at Brown and one of the map’s co-authors.
The researchers combined images from the Voyager and Galileo spacecraft to put the map together. Voyager was the first mission to fly through the Jupiter satellite system and passed by the icy surface of Ganymede in 1979. Those first images revealed a complex surface, segmented and fractured into dark and light terrain. In 1995, the Galileo spacecraft was placed in orbit around Jupiter and began to return high-resolution images of the surface that help to understand many of the features seen at low-resolution by Voyager.
Head was a co-investigator on the Galileo’s Solid State Imaging (SSI) experiment. In that role, he and his team were responsible for planning the imaging sequences for Ganymede in order to identify and investigate the scientific targets of highest priority. The team worked for several years to obtain the data necessary to make the global map.
“This was an amazing time,” Head said. “Brown graduate and undergraduate students worked shoulder-to-shoulder in the Planetary Geosciences Laboratory in Lincoln Field Building, studying the newly acquired images and choosing new sites of scientific interest. The discoveries were daily and the adrenaline was surging as we rushed to collect our thoughts and plans, review them with the SSI Team, and get them uploaded to the spacecraft in time for the next encounter.”
Geoffrey Collins was one of the graduate students looking at the data as it came in from Galileo. Wes Patterson and Louise Prockter, now at the Johns Hopkins University Applied Physics Laboratory, also started work on the project as graduate students at Brown. Robert Pappalardo, now at NASA’s Jet Propulsion Lab, was part of the team during postdoctoral studies at Brown.
“I’m so glad all that work has paid off in the form of this detailed global map,” Head said. “It is equally rewarding to see that the Brown team has now moved on to positions of leadership in the planetary exploration research community.”
Quelle: Brown University
.
Global Geologic Map of Ganymede

Summary
Ganymede is the largest satellite of Jupiter, and its icy surface has been formed through a variety of impact cratering, tectonic, and possibly cryovolcanic processes. The history of Ganymede can be divided into three distinct phases: an early phase dominated by impact cratering and mixing of non-ice materials in the icy crust, a phase in the middle of its history marked by great tectonic upheaval, and a late quiescent phase characterized by a gradual drop in heat flow and further impact cratering. Images of Ganymede suitable for geologic mapping were collected during the flybys of Voyager 1 and Voyager 2 (1979), as well as during the Galileo Mission in orbit around Jupiter (1995–2003). This map represents a synthesis of our understanding of Ganymede geology after the conclusion of the Galileo Mission.
We summarize the properties of the imaging dataset used to construct the map, previously published maps of Ganymede, our own mapping rationale, and the geologic history of Ganymede. Additional details on these topics, along with detailed descriptions of the type localities for the material units, may be found in the companion paper to this map (Patterson and others, 2010).
Quelle: USGS
5741 Views
