.

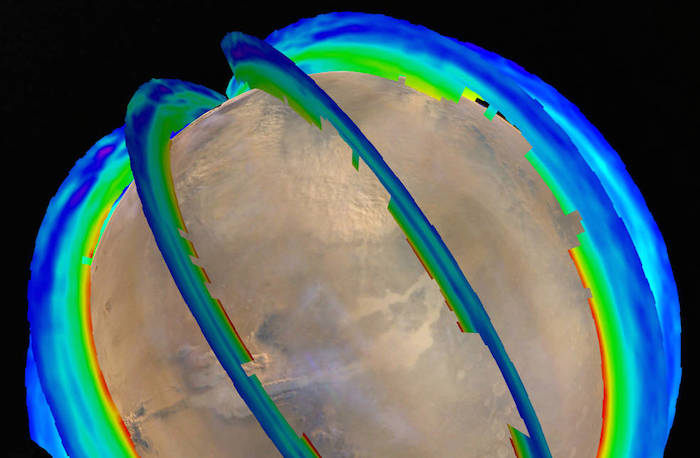
This graphic presents Martian atmospheric temperature data as curtains over an image of Mars taken during a regional dust storm. The temperature profiles extend from the surface to about 50 miles up. Temperatures are color coded, from minus 243 degrees Fahrenheit (purple) to minus 9 F (red).
Credits: NASA/JPL-Caltech/MSSS
-
After decades of research to discern seasonal patterns in Martian dust storms from images showing the dust, but the clearest pattern appears to be captured by measuring the temperature of the Red Planet's atmosphere.
For six recent Martian years, temperature records from NASA Mars orbiters reveal a pattern of three types of large regional dust storms occurring in sequence at about the same times each year during the southern hemisphere spring and summer. Each Martian year lasts about two Earth years.
"When we look at the temperature structure instead of the visible dust, we finally see some regularity in the large dust storms," said David Kass of NASA's Jet Propulsion Laboratory, Pasadena, California. He is the instrument scientist for the Mars Climate Sounder on NASA's Mars Reconnaissance Orbiter and lead author of a report about these findings posted this week by the journal Geophysical Research Letters.
"Recognizing a pattern in the occurrence of regional dust storms is a step toward understanding the fundamental atmospheric properties controlling them," he said. "We still have much to learn, but this gives us a valuable opening."
Dust lofted by Martian winds links directly to atmospheric temperature: The dust absorbs sunlight, so the sun heats dusty air more than clear air. In some cases, this can be dramatic, with a difference of more than 63 Fahrenheit degrees (35 Celsius degrees) between dusty air and clear air. This heating also affects the global wind distribution, which can produce downward motion that warms the air outside the dust-heated regions. Thus, temperature observations capture both direct and indirect effects of the dust storms on the atmosphere.
Improving the ability to predict large-scale, potentially hazardous dust storms on Mars would have safety benefits for planning robotic and human missions to the planet's surface. Also, by recognizing patterns and categories of dust storms, researchers make progress toward understanding how seasonal local events affect global weather in a typical Mars year.
NASA has been operating orbiters at Mars continuously since 1997. The Mars Climate Sounder on Mars Reconnaissance Orbiter, which reached Mars in 2006, and the Thermal Emission Spectrometer on Mars Global Surveyor, which studied Mars from 1997 to 2006, have used infrared observations to assess atmospheric temperature. Kass and co-authors analyzed temperature data representative of a broad layer centered about 16 miles (25 kilometers) above the Martian surface. That's high enough to be more affected by regional storms than by local storms.
Most Martian dust storms are localized, smaller than about 1,200 miles (about 2,000 kilometers) across and dissipating within a few days. Some become regional, affecting up to a third of the planet and persisting up to three weeks. A few encircle Mars, covering the southern hemisphere but not the whole planet. Twice since 1997, global dust storms have fully enshrouded Mars. The behavior of large regional dust storms in Martian years that include global dust storms is currently unclear, and years with a global storm were not included in the new analysis.
Three large regional storms, dubbed types A, B and C, all appeared in each of the six Martian years investigated.
Multiple small storms form sequentially near Mars' north pole in the northern autumn, similar to Earth's cold-season arctic storms that swing one after another across North America.
"On Mars, some of these break off and head farther south along favored tracks," Kass said. "If they cross into the southern hemisphere, where it is mid-spring, they get warmer and can explode into the much larger Type A dust storms."
Southern hemisphere spring and summer on modern-day Mars are much warmer than northern spring and summer, because the eccentricity of Mars' orbit puts the planet closest to the sun near the end of southern spring. Southern spring and summer have long been recognized as the dustiest part of the Martian year and the season of global dust storms, even though the more detailed pattern documented in the new report had not been previously described.
When a Type A storm from the north moves into southern-hemisphere spring, the sunlight on the dust warms the atmosphere. That energy boosts the speed of winds. The stronger winds lift more dust, further expanding the area and vertical reach of the storm.
In contrast, the Type B storm starts close to the south pole shortly before the beginning of southern summer. Its origin may be from winds generated at the edge of the retreating south-polar carbon dioxide ice cap. Multiple storms may contribute to a regional haze.
The Type C storm starts after the B storm ends. It originates in the north during northern winter (southern summer) and moves to the southern hemisphere like the Type A storm. From one year to another, the C storm varies more in strength, in terms of peak temperature and duration, than the A and B storms do.
The longevity of NASA's Mars Reconnaissance Orbiter has helped enable studies such as this of seasonal patterns on Mars. JPL provided the Mars Climate Sounder instrument and manages the mission for NASA's Science Mission Directorate. Arizona State University, Tempe, provided the Thermal Emission Spectrometer for Mars Global Surveyor. Lockheed Martin Space Systems, Denver, built both orbiters.
-----
Seasonal Temperature Pattern Indicating Martian Dust Storms

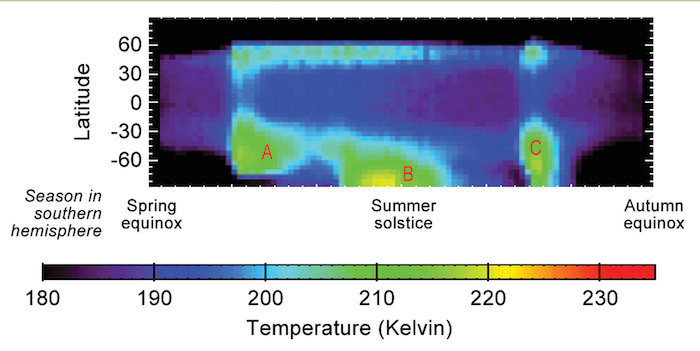
This graphic shows Martian atmospheric temperature data related to seasonal patterns in occurrence of large regional dust storms. The data shown here were collected by the Mars Climate Sounder instrument on NASA's Mars Reconnaissance Orbiter over the course of one-half of a Martian year, during 2012 and 2013. The color coding indicates daytime temperatures of a layer of the atmosphere centered about 16 miles (25 kilometers) above ground level, corresponding to the color-key bar at the bottom of the graphic.
Three regional dust storms indicated by increased temperatures are labeled A, B and C. A similar sequence of three large regional dust storms has been seen in atmosphere-temperature data from five other Martian years.
The vertical axis is latitude on Mars, from the north pole at the top to south pole at the bottom. Each graphed data point is an average for all Martian longitudes around the planet. The horizontal axis is the time of year, spanning from the beginning of Mars' southern-hemisphere spring (on the left) to the end of southern-hemisphere summer. This is the half of the year when large Martian dust storms are most active.
NASA's Jet Propulsion Laboratory, Pasadena, California, built and operates the Mars Climate Sounder, and manages the Mars Reconnaissance Orbiter mission. Lockheed Martin Space Systems, Denver, built the orbiter.
Quelle: NASA
5636 Views
