.
SPoRT Satellite Image as Detected by the Visible Infrared Imaging Radiometer Suite Sensor of the Post Kathmandu Earthquake.
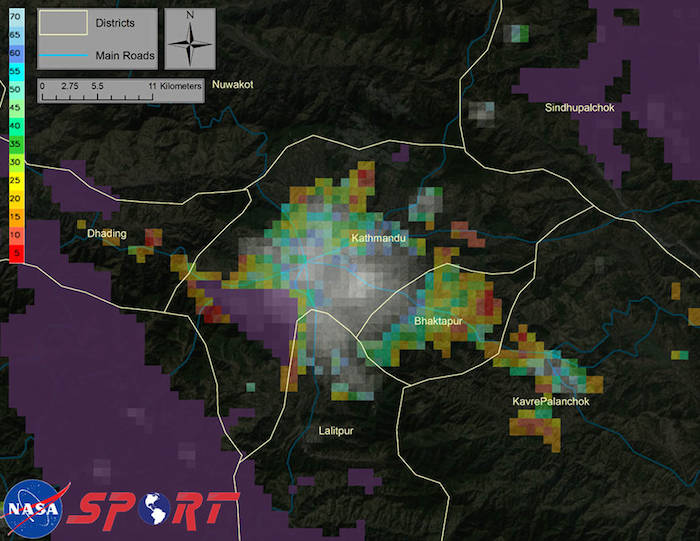
In the wake of the April 25, 2015 earthquake in Nepal, NASA’s Short-term Prediction Research and Transition, SPoRT, project at Marshall Space Flight Center has developed satellite imagery to assist decision makers in post disaster analysis and assessment.
The experimental image shows a decrease in emitted light over the city of Kathmandu and surrounding areas as detected by the Visible Infrared Imaging Radiometer Suite (VIIRS) “Day-Night Band” sensor aboard the NASA/NOAA Suomi National Polar-Orbiting Partnership satellite, derived from a comparison of pre-earthquake (22 April 2015) and post-earthquake (26 April 2015) imagery. In this percent of normal product, the warm colors (red – yellow) indicate the largest reduced light emissions in the post-event image, possibly due to damage to electrical infrastructure. Clouds in the scene are shaded in purple, which will contaminate the comparison. Towns and suburban areas around Kathmandu show the larger percentage of reduced light emission. Input satellite data were obtained in collaboration with the NASA Suomi NPP Science Investigator-led Processing System activities at the University of Wisconsin.
This information can help relief operations determine areas that may be affected by electrical outages.
Images Produced By: The Short-term Prediction Research and Transition (SPoRT) team at NASA’s Marshall Space Flight Center in Huntsville, AL.
.
GPS Data Show How Nepal Quake Disturbed Earth’s Upper Atmosphere
.
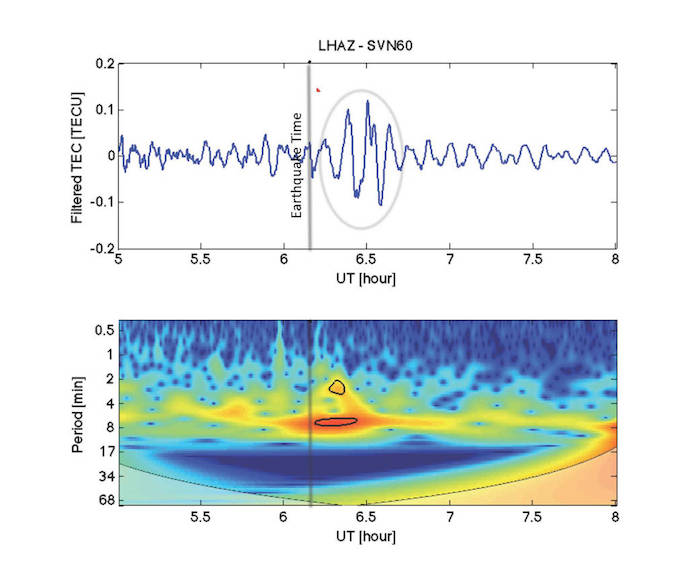
The April 25, 2015, magnitude 7.8 Gorkha earthquake in Nepal created waves of energy that penetrated into Earth's upper atmosphere in the vicinity of Nepal, disturbing the distribution of electrons in the ionosphere. The ionosphere is a region of Earth's upper atmosphere located from about 37 miles (60 kilometers) to 621 miles (1,000 kilometers) above Earth’s surface. These disturbances were monitored using signals transmitted by the Global Positioning System (GPS) that were received by a science-quality GPS receiver located in a neighboring region to Nepal.
The disturbance measurements, known as vertical total electron content (VTEC) (depicted in blue in the upper panel), have been filtered using processing software developed by NASA’s Jet Propulsion Laboratory, Pasadena, California, to show wave-like disturbances (circled in red) in the distribution of electrons in the ionosphere. The waves have periods of between two and eight minutes in length. The disturbance measurements following the earthquake rupture are circled in black in the lower panel. The colors represent the relative strengths of the earthquake-induced ionospheric disturbances as captured by the GPS signals, with red being high and blue being low.
The data show that after the initial earthquake rupture (indicated by the vertical black line) it took about 21 minutes for the earthquake-generated ionospheric disturbance to reach a GPS station (LHAZ), located about 400 miles (640 kilometers) away from the epicenter in Lhasa, Tibet, China. The station is hosted at the Tibet Autonomous Regional Bureau of Surveying and Mapping Institute. The site collects both GPS and GLONASS (the Russian global navigation satellite system) data at a rate of 1 Hertz and is part of an international scientific collaboration known as the International GPS Service (IGS)
Scientists study ionosphere-based measurements caused by natural hazards such as earthquakes, volcanic eruptions and tsunamis to better understand wave propagation in the upper atmosphere. The disturbances caused by earthquakes help scientists develop new first-principle-based wave propagation models. These models may become part of future early warning systems for tsunamis and other difficult-to-detect natural hazards.
.
NASA-Generated Damage Map to Assist with 2015 Gorkha, Nepal Earthquake Disaster Response
-
-
NASA data and expertise are providing valuable information for the ongoing response to the April 25, 2015, magnitude 7.8 Gorkha earthquake in Nepal. The quake has caused significant regional damage and a humanitarian crisis. It was the strongest earthquake to occur in that vicinity since a magnitude 8.0 quake there in 1934 that caused more than 10,000 fatalities.
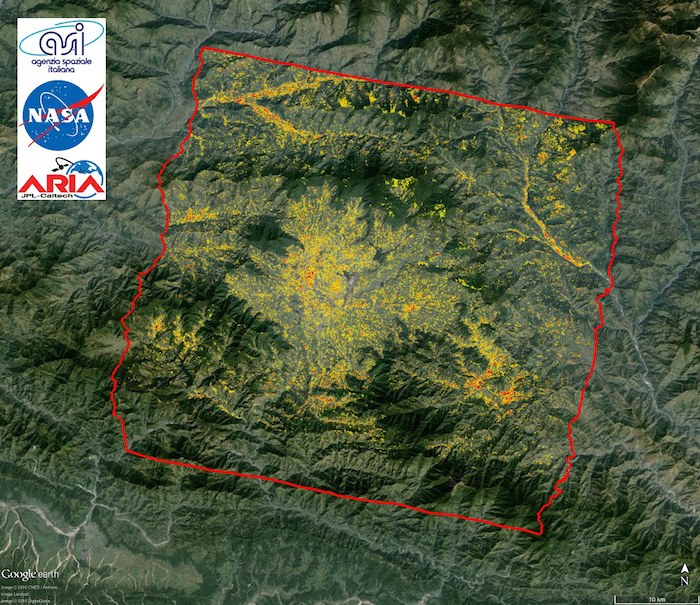
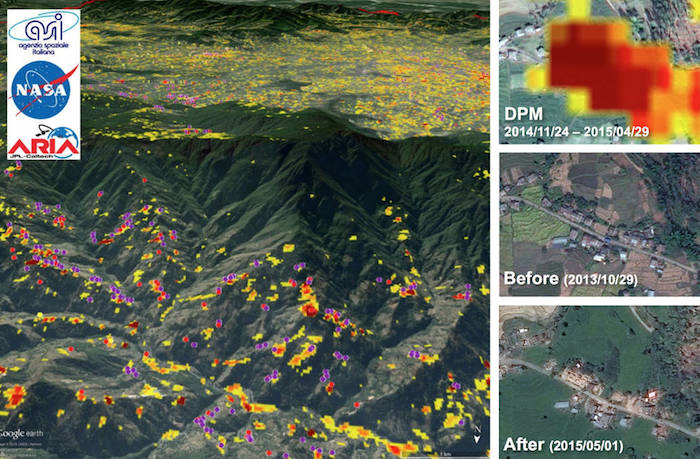
To assist in the disaster response efforts, scientists at NASA's Jet Propulsion Laboratory, Pasadena, California, and California Institute of Technology in Pasadena, in collaboration with the Italian Space Agency (ASI), generated these images of the earthquake’s hardest-hit region.
The 25-by-31 mile (40-by-50 kilometer) Damage Proxy Map (DPM), which covers the region around Kathmandu, was processed by the Advanced Rapid Imaging and Analysis (ARIA) team at JPL and Caltech using X-band interferometric synthetic aperture radar data from ASI’s COSMO-SkyMed satellite constellation. The technique uses a prototype algorithm to rapidly detect surface changes caused by natural or human-produced damage. The assessment technique is most sensitive to destruction of the built environment. When the radar images areas with little to no destruction, its image pixels are transparent. Increased opacity of the radar image pixels reflects damage, with areas in red reflecting the heaviest damage to cities and towns. The color variations from yellow to red indicate increasingly more significant ground surface change. The time span of the data for the change is Nov. 24, 2014 to April 29, 2015. Each pixel in the damage proxy map is about 100 feet (30 meters) across.
The perspective image below the main image shows the DPM overlaid on the terrain with the locations of damaged buildings identified by the National Geospatial-Intelligence Agency (NGA) preliminary damage assessment, indicated by the red and purple dots. As an example, the images on the side show how red regions in the DPM correlate with damaged buildings, as shown by the collapsed structures in the "after" image. The base map images were provided by Google. Before and after images were provided by DigitalGlobe.
Preliminary validation was done by comparing to damage assessment from imagery by NGA (April 30, 2015 preliminary damage assessment product) and the United Nations (UNITAR/UNOSAT) in collaboration with the U.S. Geological Survey (USGS) and the University of Basilicata.
ARIA is a JPL- and NASA-funded project being developed by JPL and Caltech. It is building an automated system for providing rapid and reliable GPS and satellite data to support the local, national and international hazard monitoring and response communities. Using space-based imagery of disasters, ARIA data products can provide rapid assessments of the geographic region impacted by a disaster, as well as detailed imaging of the locations where damage occurred. COSMO-SkyMed data was made freely available for the disaster response by ASI.
-
NASA's ARIA Project Maps Deformation of Earth's Surface from Nepal Quake
.
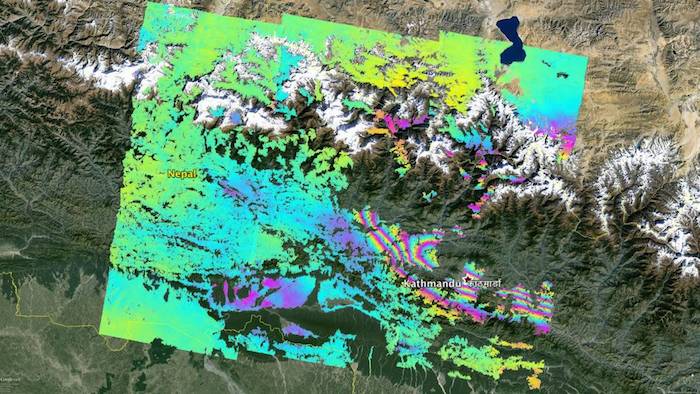
NASA and its partners are contributing important observations and expertise to the ongoing response to the April 25, 2015, magnitude 7.8 Gorkha earthquake in Nepal. The quake was the strongest to occur in that area since the 1934 Nepal-Bihar magnitude 8.0 event and caused significant regional damage and a humanitarian crisis.
Scientists with the Advanced Rapid Imaging and Analysis project (ARIA), a collaboration between NASA's Jet Propulsion Laboratory, Pasadena, California, and the California Institute of Technology in Pasadena, analyzed interferometric synthetic aperture radar images from the European Union's Copernicus Sentinel-1A satellite, operated by the European Space Agency and also available from the Alaska Satellite Facility (https://www.asf.alaska.edu), to calculate a map of the deformation of Earth's surface caused by the quake. This false-color map shows the amount of permanent surface movement caused almost entirely by the earthquake, as viewed by the satellite, during a 12-day interval between two Sentinel-1 images acquired on April 17 and April 29, 2015.
In the map, surface displacements are seen as color contours (or "fringes"), where each color cycle represents 8 inches (20 centimeters) of surface motion. The contours show the land around Kathmandu has moved upward by more than 40 inches (1 meter). Areas without the color contours have snow or heavy vegetation that affects the radar measurements. Scientists use these maps to build detailed models of the fault and associated land movements to better understand the impact on future earthquake activity. The background image is from Google Earth. The map contains Copernicus data (2015).
.
Landsat 8 Reveals Extent of Quake Disaster in Nepal’s Langtang Valley
.
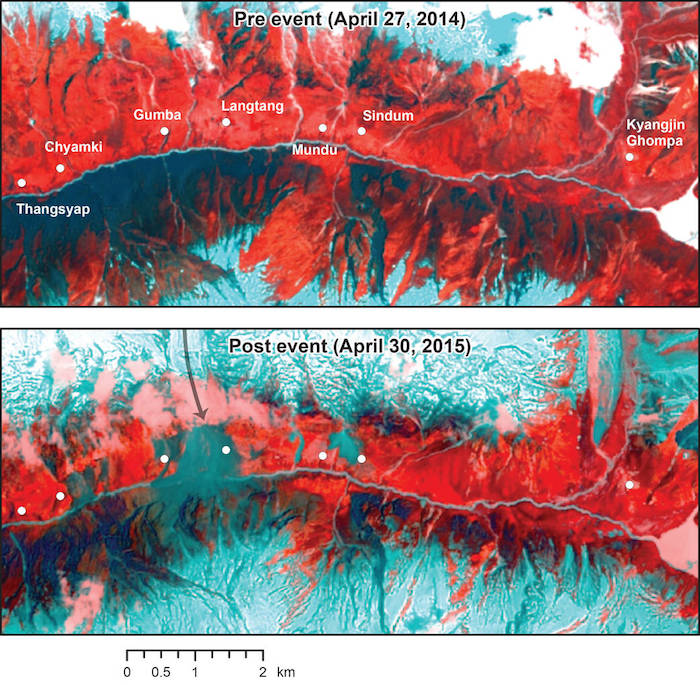
The magnitude 7.8 Gorkha earthquake that struck Nepal on April 25, 2015, caused extensive damage in Kathmandu Valley and severely affected Nepal's rural areas. The Langtang Valley in the Rasuwa district was particularly hard hit, as became apparent from pictures taken by a rescue helicopter mission on April 26. Numerous tourists and Nepali were, or are, still trapped in the valley as access is completely blocked by avalanches and landslides. The valley’s main village, Langtang , was completely destroyed by the earthquake and the large, wet, debris- and ice-rich avalanche and likely pressure wave from dust avalanche that it triggered, resulting in an unknown number of casualties. Other avalanches also struck elsewhere in the valley.
Space agencies around the world are providing extensive resources in a huge international effort. They are tasking their satellites to observe the areas hit by the earthquake. This effort began immediately after the disaster. Imaging initially focused on Kathmandu. Following the first social media reporting of the helicopter pilot’s comments, an emergency NASA-USGS-interagency Earthquake Response Team alerted satellite mission operations teams about the likely serious plight of Langtang and other Himalayan valleys. Advisories were also delivered to Nepal officials. The first relief missions arrived in the Langtang Valley about April 28.
United States Geological Survey/NASA Landsat-8 satellite observations were first obtained over Nepal after the earthquake on April 30. Landsat 8 acquired the first largely cloud-free image of the Langtang Valley (post-event Landsat image ID: LS081410412015043000000000MS00_GO006005004). Scientists analyzed the imagery and compared it with pre-earthquake imagery from a year earlier.
The analyses revealed the true extent of the disaster that took place in the Langtang Valley. Part of Langtang village was completely buried by a very large rock and ice avalanche that originated on the northwestern slopes above the village. The eastern part of Langtang village appears to have been destroyed by the pressure wave from the related dust avalanche. Large landslides or avalanches also affected the villages of Thyangshyup, Tsarding, Chyamki, Gumba, Mundu, Sindum and Kyangjing. The extent of the damage around these small settlements will require further investigation using higher-resolution imagery to be obtained from satellites, and word from relief crews on the ground. The river at the Langtang village avalanche appears to be blocked, but there is no evidence yet of a lake forming behind the blockage. This may indicate that the water has found its way through the debris, snow and ice. The valley is vulnerable to secondary events such as mudslides and debris and ice avalanches, and this situation could continue into the coming monsoon. Researchers will continue to monitor this situation closely using satellite data.
These scientists are part of a 35-member international volunteer group led by University of Arizona scientists Jeffrey Kargel and Gregory Leonard, who launched the group soon after the earthquake occurred. This effort has been incorporated into the NASA-USGS-interagency Earthquake Response Team. Their goal is to systematically investigate the entire quake-affected area using remote sensing. Their results will support relief operations and identify secondary hazards, such as glacier lake outbursts, rivers blocked by landslides and other unstable areas. This is the first volunteer report of the project.
.
Nepal's Imja Lake, Khumbu Region, Appears Resilient Against Gorkha Quake
.
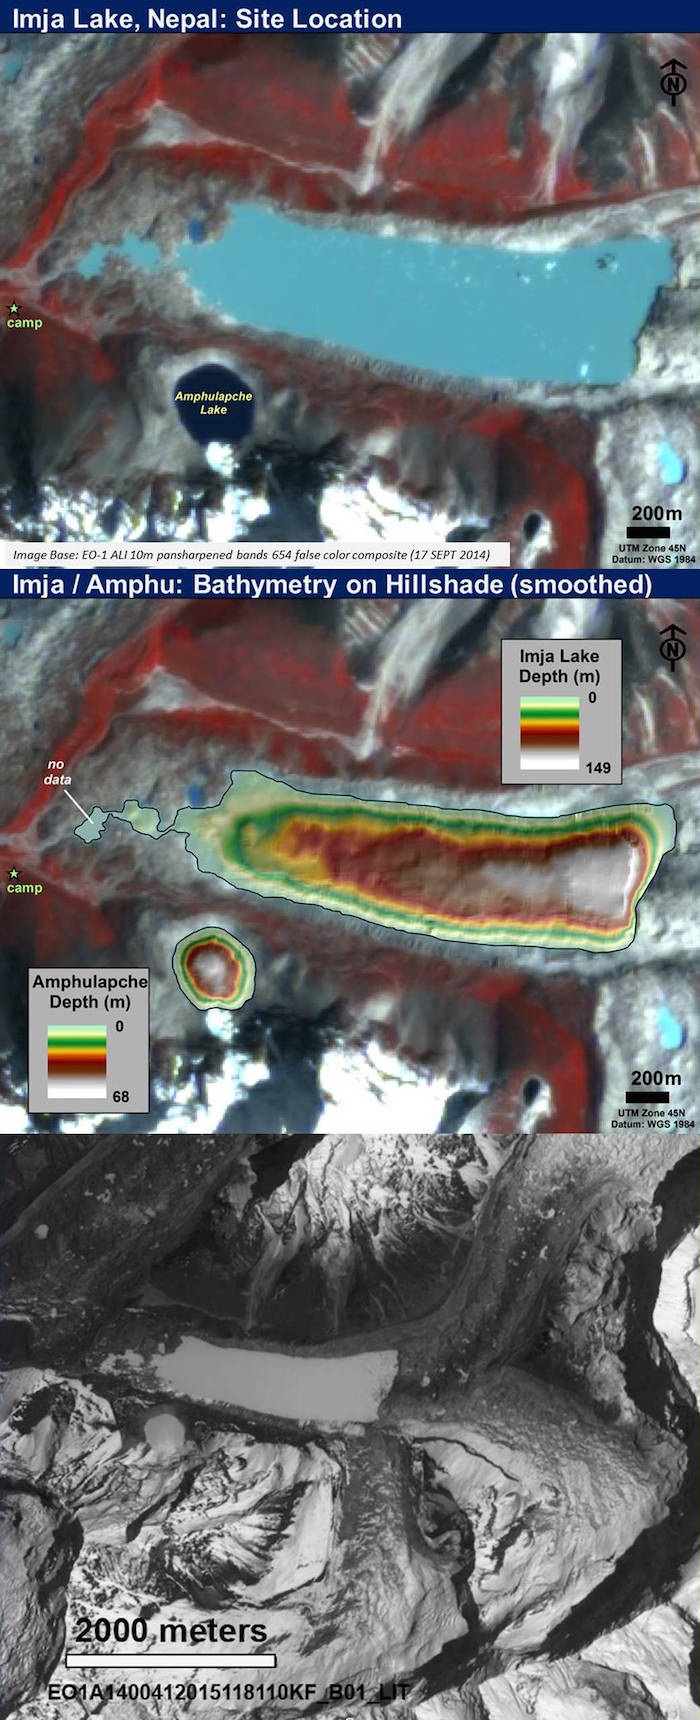
Nepal's Imja Lake is a typical large glacial lake created by a moraine dam (formed by accumulations of dirt and rocks -- commonly cemented by ice -- that have been transported and deposited by a glacier). Located near Mount Everest, the local topographic relief is extremely high. Imja Lake was recently the site of an intensive scientific survey supported by the United Nations' Development Program to re-assess the outburst flood potential of the lake and to design and, this spring, implement a project to lower the lake level and reduce the flood hazard. The project had not been completed when the earthquake struck. The lake is also the site of a planned micro-hydroelectric power plant.
The lake began forming as a series of ponds on the glacier surface around 1960. By the mid 1970’s, the ponds had combined into a single large lake, which has continued to grow since then as the glaciers feeding it have retreated and thinned. The lake’s growth effectively cut off what had been the debris-covered terminus of the glacier, which now stands as an ice-cored end moraine. The moraine’s unconsolidated rock debris and the ice have been unstable, both gravitationally and thermally, for many years. The high lateral moraines, the high bedrock ridges that almost surround the lake, and the hanging glaciers perched above it could be de-stabilized, such as from ground shaking, and trigger an outburst flood. Fortunately, the present lake level is only about 100 feet (30 meters) higher than the area immediately downstream from the end moraine, thereby limiting the volume of water that could be released. The wideness of the end moraine previously had reduced the chances of a sudden outburst, but the growth in the past few years of ponds on the end moraine has weakened the dam, making it less able to contain the lake.
A bathymetric (lake depth) map from the recent survey is shown above, superposed on an EO-1 ALI image dating from before the earthquake. The survey found the lake to be up to 492 feet (149.8 meters) deep and to contain about 75 million cubic meters of water, of which about one-third is readily drainable in the event of a glacier lake outburst flood. The aforementioned lake lowering will reduce the level by only 10 feet (3 meters), which will reduce the outburst flood problem but not eliminate it.
The lake remains very hazardous, so it is with much relief that Imja Lake survived the 2015 Gorkha quake without huge effects visible in the first acquired post-quake satellite image from NASA’s EO-1 satellite (black and white image below). However, further satellite image analysis and boots and eyes on the ground are needed to confirm this.
This work is supported by NASA’s SERVIR Applied Science Team and is in support of the emergency NASA-USGS-Interagency Earthquake Response Team.
Quelle: NASA
4906 Views
