
11.06.2024
ISRO Shares Pics Of Sun's Dynamic Activities, Captured By Aditya-L1
SoLEXS and HEL1OS, two of the remote sensing payloads on board Aditya-L1, have captured these events between May 8-9.
The Indian Space Research Organisation (ISRO) on Monday shared photographs depicting the dynamic activities of the Sun during the last month. These have been captured by the Solar UltraViolet Imaging Telescope (SUIT) and the Visible Emission Line Coronagraph (VELC) onboard the Aditya-L1 spacecraft.
In an official statement, ISRO said that during the May 8-15 week, the Active region AR13664 on the Sun - said to be one of the biggest sunspots in recorded history - during its passage erupted several X-class and M-class flares that were associated with Coronal Mass Ejections (CMEs) between May 8 and 9. This later produced a major geomagnetic storm on May 11.
SoLEXS and HEL1OS, two of the remote sensing payloads on board Aditya-L1, have captured these events between May 8-9. Meanwhile, the other two in-situ payloads — ASPEX and MAG — captured the event during the May 10-11 period when it passed through L1, the statement added.
Sharing the pictures on X (formerly Twitter), ISRO said, "UIT and VELC instruments have captured the dynamic activities of the Sun during May 2024. Several X-class and M-class flares, associated with coronal mass ejections, leading to significant geomagnetic storms were recorded.”
Let's take a look at what these two instruments observed:
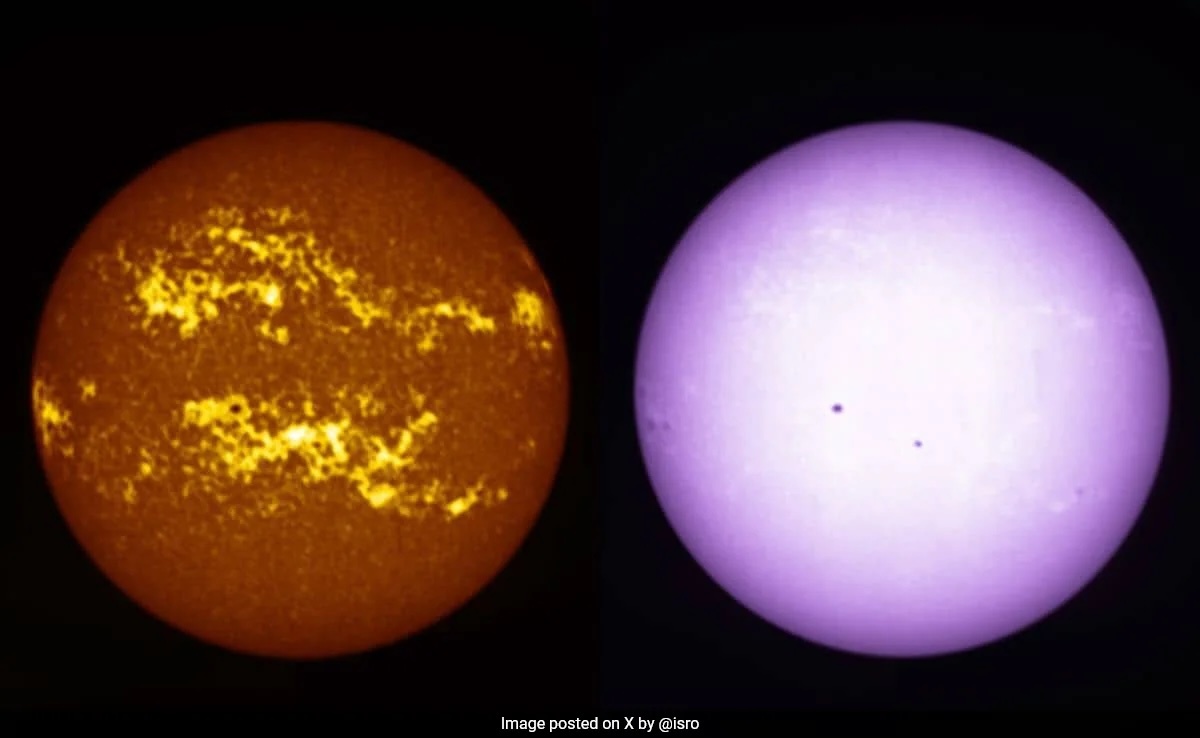
SUIT observations
The images of the Sun acquired by the SUIT payload on May 17 show bright, active regions on the Solar disk in Mg II k line (NB3).
"The active regions signify magnetically active regions on the Sun's surface. Large solar flares may originate in these active regions due to changes in magnetic field," ISRO stated, adding that the Sun moves towards solar maximum, giving rise to enhanced activity.
As a result, there are multiple active regions visible around the equatorial region.
In Narrow Band 276 nm (NB2), the continuum emission shows the sunspots in the active regions, while plages around them remain visible.
"The relative brightness of the sunspots are different from 276 nm narrow band," the statement said.
It noted that such variation appears as the different narrow bands probe different heights of the atmosphere, probing the structural difference of the magnetic tubes at different heights.
VELC Observations
The VELC carried out observations in one of the spectroscopic channels for the emission line 5303 Angstrom, the ISRO statement added.
For capturing the coronal activities in this particular spectral line, the raster scans of the solar corona were carried out on May 14. The AR 13664 location is marked in the raster image as a box.
This is created by "assembling the wavelength-averaged slit images as the Sun is rastered on the slit of the spectrograph," ISRO stated.
Noting that the raster's duration is about 20 minutes, it added that the same used four slits covering different regions of the solar corona simultaneously.
In the image, the yellow “open” circle indicates the edge of the solar photosphere, which is also the “visible” disk of the Sun.
The black “filled” circle, meanwhile, indicates the extent of the occulting disk used in the VELC for blocking the bright light of the solar photosphere to observe the relatively million times faint structures in the solar corona.
Quelle: NDTV