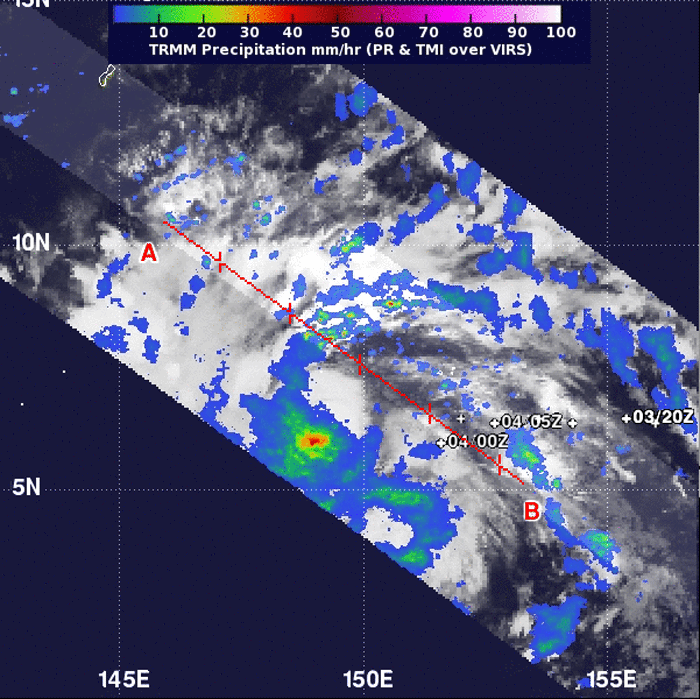
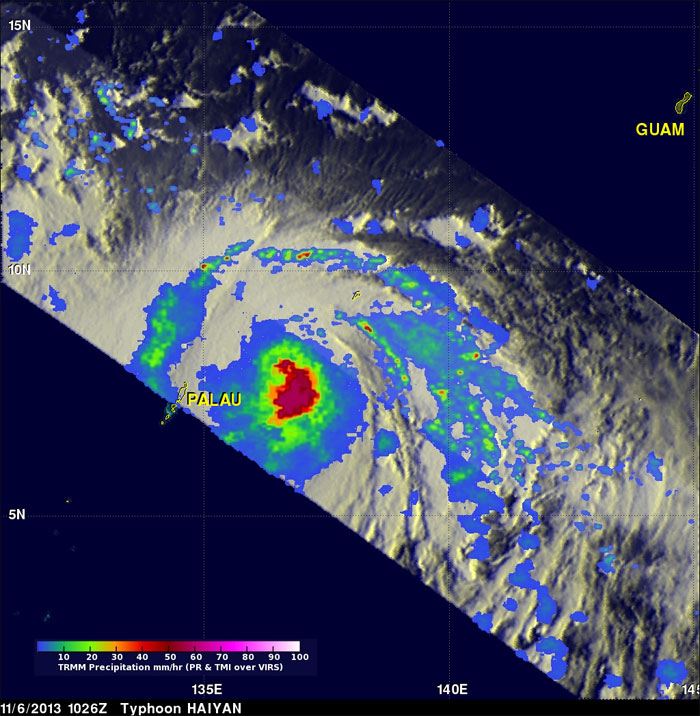
Data from TRMM's TMI and PR instruments on Nov. 6 at 1026 UTC revealed that rain was falling at a rate of over 100mm/~3.9 inches per hour (purple) around Haiyan's eye.
.
Super-Typhoon Haiyan was lashing the central and southern Philippines on Nov. 7 bringing maximum sustained winds of a Category 5 hurricane. NASA is providing visible, infrared and microwave satellite data to forecasters and warnings are in effect for the Philippines and Micronesia as Haiyan moves west.
Brian McNoldy, a Senior Research Associate at the University of Miami's Rosenstiel School of Marine and Atmospheric Science in Miami, Fla. noted that on the morning (EST) of Nov. 7, "Haiyan has achieved tropical cyclone perfection. It is now estimated at 165kts (190mph), with an 8.0 on the Dvorak scale... the highest possible value."
Warnings in the Philippines have been raise throughout much of the country. In Luzon:
Signal #1 is in effect for : Camarines Norte & Sur, Catanduanes, Mindoro Provinces, Marinduque, Northern Palawan, Calamian Group of Islands, and Southern Quezon.
Signal #2 is in effect for: Romblon, Sorsogon, Albay, Ticao and Burias island.
In Visayas, Signal #1 is in effect for Squijor, and Signal #2 is in effect for: Bohol, Negros Occidental and Oriental, Aklan, Capiz, Antique, rest of Cebu, Iloilo and Guimara. Signal #3 is in effect for: Northern Samar, Masbate, northern Cebu, Cebu City and Bantayan island, and Signal #4 is in effect for: Eastern Samar, Samar, Leyte, Southern Leyte and Biliran island.
In Mindanao, Signal #1 was posted for: Misamis Oriental, Agusan del Sur; Signal #2 for: Camiguin, Surigao del Norte & Sur and Agusan del Norte and Signal #3 is in effect for: Siargao Island and Dinagat province.
In Micronesia, a Typhoon Warning is in effect for Kayangel and Koror in the Republic of Palau and Ngulu in Yap State.
Early on Nov. 7, NASA's Aqua satellite passed over Super Typhoon Haiyan as it was approaching the Philippines. The Moderate Resolution Imaging Spectroradiometer or MODIS instrument aboard captured a visible image on Nov. 7, 2013 at 04:25 UTC/Nov. 6 at 11:25 p.m. EDT that showed the thick bands of powerful thunderstorms that surrounded the eye. The MODIS image also revealed a powerful, wide band of thunderstorms in the western quadrant that was affecting the Philippines in the early morning hours (Eastern Daylight Time/U.S.) on Nov. 7.
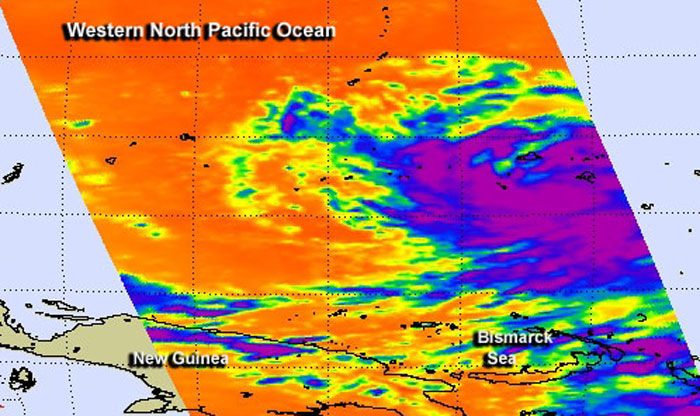
At the same time, another instrument aboard Aqua captured infrared data on the storm using the Atmospheric Infrared Sounder or AIRS instrument, providing cloud top temperatures and sea surface temperatures. The infrared data revealed a sharply defined eye with multiple concentric rings of thunderstorms and a deep convective eyewall. The infrared data showed cloud top temperatures as cold as 210 degrees kelvin/-81.67F/-63.15C/ in the thick band of thunderstorms around the center. Those cold temperatures indicate very high, powerful thunderstorms with very heavy rain potential.
On Nov. 7 at 1500 UTC/10 a.m. EDT, Super-Typhoon Haiyan's maximum sustained winds were near 165 knots/189.9 mph/305.6 kph. Haiyan is a Category 5 storm on the Saffir-Simpson hurricane scale. The Joint Typhoon Warning Center estimated that gusts are as strong as 200 knots/ 230.2 mph/370.4 kph.
The U.S. National Hurricane Center website indicates that a Category 5 hurricane/typhoon would cause catastrophic damage: A high percentage of framed homes will be destroyed, with total roof failure and wall collapse. Fallen trees and power poles will isolate residential areas. Power outages will last for weeks to possibly months. Most of the area will be uninhabitable for weeks or months.
Haiyan was located near 10.4 north latitude and 128.1 east longitude, about 543 nautical miles east-southeast of Manila, Philippines. It is moving west-northwest at 22 knots/25.3 mph/40.7 kph and generating extremely rough seas with wave heights to 50 feet/15.2 meters.
The Joint Typhoon Warning Center noted that extremely favorable environmental conditions such as the warm waters ahead of the system will help to maintain its strength at super typhoon intensity through landfall in the central Philippines and up to 1500 UTC/10 a.m. EDT on Nov. 8. According to forecast track, Manila is now expected to be impacted by the northeastern quadrant, the strongest side of the storm.
After passing through the Philippines, Haiyan is expected to move through the South China Sea as it heads for landfall in Vietnam.
.
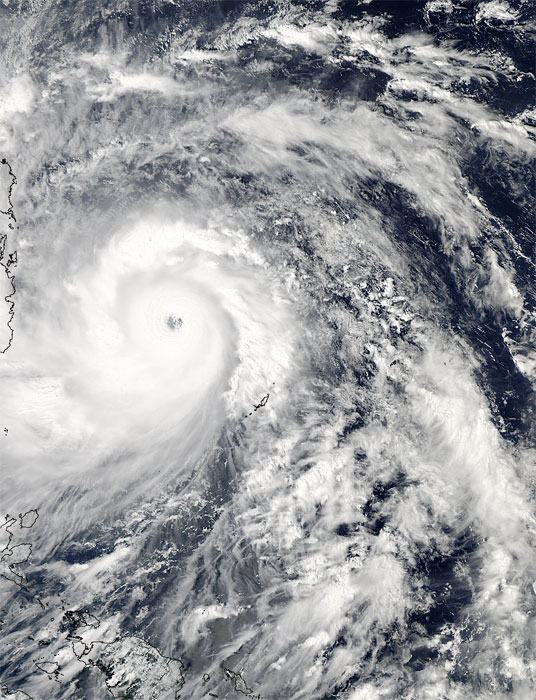
This visible image of Super Typhoon Haiyan approaching the Philippines was taken from the MODIS instrument aboard NASA's Aqua satellite on Nov. 7, 2013 at 04:25 UTC/Nov. 6 at 11:25 p.m. EDT.
Image Credit: NASA Goddard MODIS Rapid Response Team
.
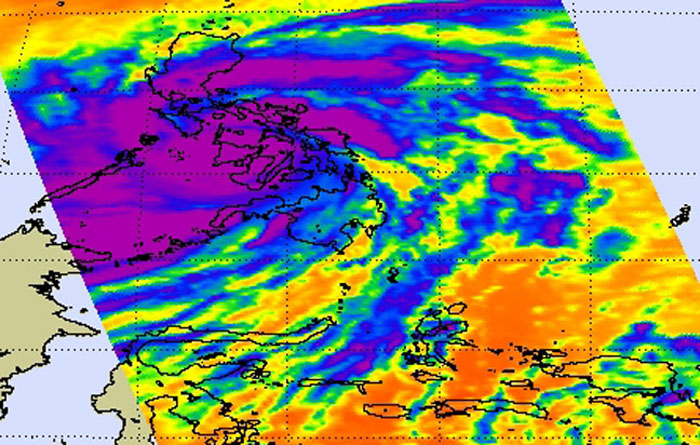
The AIRS instrument aboard NASA's Aqua satellite captured this infrared, false-colored image of Super-Typhoon Haiyan exiting the western Philippines on Nov. 8 at 04:59 UTC. Purple indicates coldest, most powerful thunderstorms with heavy rainfall potential.
Image Credit: NASA JPL/Ed Olsen
.
Update #2 - NASA's TRMM Satellite Sees Super-typhoon Haiyan Strike Philippines
.
Super-typhoon Haiyan, equivalent to a Category 5 hurricane on the U.S. Saffir-Simpson scale, struck the central Philippines municipality of Guiuan at the southern tip of the province of Eastern Samar early Friday morning at 20:45 UTC (4:45 am local time). NASA's TRMM satellite captured visible, microwave and infrared data on the storm.
Haiyan made landfall as an extremely powerful super typhoon, perhaps the strongest ever recorded at landfall, with sustained winds estimated at 195 mph (315 kph) by the Joint Typhoon Warning Center. Previously, Hurricane Camille, which struck the northern Gulf Coast in 1969, held the record with 190 mph sustained winds at landfall. After striking Samar, Haiyan quickly crossed Leyte Gulf and the island of Leyte as it cut through the central Philippines.
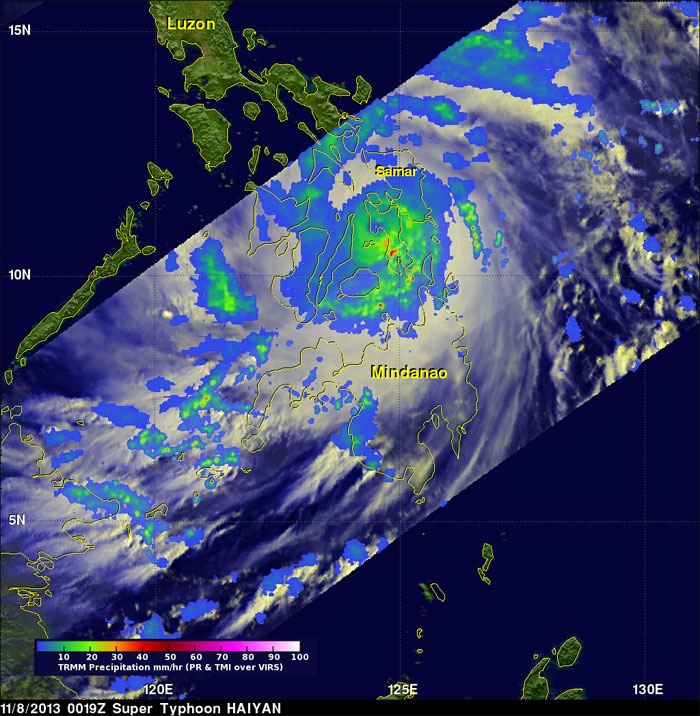
NASA's Tropical Rainfall Measuring Mission or TRMM satellite captured an image of Haiyan just as it was crossing the island of Leyte in the central Philippines. Data was taken at 00:19 UTC (8:19 a.m. local) November 8, 2013 and showed the horizontal distribution of rain intensity within the Haiyan. Rain rates in the center of the swath were generated from the TRMM Precipitation Radar (PR), and those in the outer swath were from the TRMM Microwave Imager (TMI). The data was put together at NASA's Goddard Space Flight Center in Greenbelt, Md. where rain rates were overlaid on infrared (IR) data from the TRMM Visible Infrared Scanner (VIRS). It showed that Haiyan still had a well-defined eye surrounded by a symmetric area of moderate rain with several rainbands wrapping in from the south. The symmetric rain area around the eye is a testament to the storm's intensity--the stronger the storm, the more the features are smeared uniformly around the center. At the time of the image, Haiyan's sustained winds were estimated to have dropped slightly to 160 knots/~185 mph from crossing Leyte.
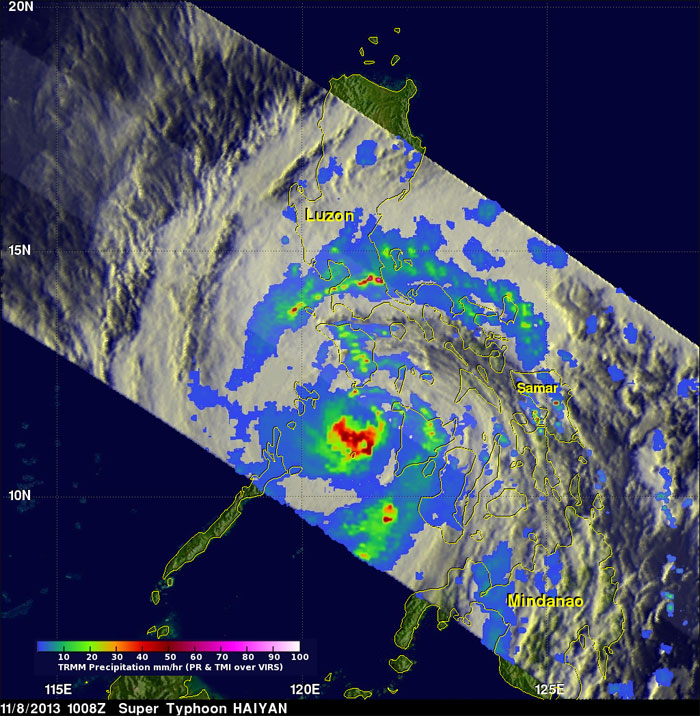
TRMM passed over Haiyan about 10 hours later on Nov. 8 at 10:08 UTC/5:08 a.m. EDT/6:08 p.m. Philippines local time. Haiyan was passing south of Mindoro as it was beginning to exit the Philippines. The center was less organized after having passed over the larger Philippines island of Panay, although a large area of heavy rain (shown in red) is now located just south of the center. At the time of this image, Haiyan's intensity was estimated to be 145 knots/~167 mph, still equivalent to a Category 5 hurricane. TRMM is a joint mission between NASA and the Japanese space agency JAXA.
On Nov. 8 at 1500 UTC/11 a.m. EDT/12 a.m. Nov. 9 Philippines local time, Haiyan's maximum sustained winds had dropped to 135 knots/155.4 mph/250 kph. It slowed a bit, moving to the west at 20 knots/23.0 mph/37.0 kph. Although Haiyan was centered near 11.8 north and 120.6 east, about 170 miles south of Manila, its extent covered most of the Philippines.
So far, four fatalities have been reported as a result of the storm, but these are preliminary as communication to many areas was knocked out. Haiyan is expected to continue moving in a general westward direction over the next 1 to 2 days before likely striking central Vietnam.
.
NASA's TRMM satellite data on Nov. 8 at 00:19 UTC showed Haiyan had a well-defined eye surrounded by a symmetric area of moderate rain (green ring with a blue center) with several rainbands wrapping in from the south (green arcs) while crossing the island of Leyte in the central Philippines.
Image Credit: NASA/SSAI, Hal Pierce
.
TRMM saw Haiyan's center was less organized after having passed over the larger Philippines island of Panay, although a large area of heavy rain (shown in ed) is now located just south of the center. Haiyan was estimated to be 145 knots (~167 mph), still equivalent to a Category 5 hurricane.
Image Credit: NASA/SSAI, Hal Pierce
.
Quelle: NASA
.
Update: 9.11.2013
.
NASA Peers Into One of Earth's Strongest Storms Ever
.
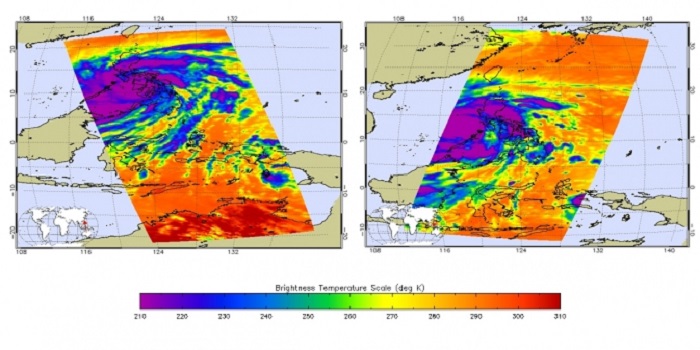
NASA’s Atmospheric Infrared Sounder (AIRS) instrument on NASA’s Aqua spacecraft captured these infrared images of Super Typhoon Haiyan at 8:59 p.m. PST Nov. 7 (left) and 9:17 a.m. PST Nov. 8 (right). The storm’s coldest cloud-top temperatures and areas of heaviest rainfall are depicted by the brightest shades of purple.
Image Credit:
NASA/JPL-Caltech
.
New satellite images just obtained from NASA’s Atmospheric Infrared Sounder (AIRS) instrument aboard NASA’s Aqua spacecraft and the Indian Space Research Organization’s OceanSAT-2 ocean wind scatterometer provide a glimpse into one of the most powerful storms ever recorded on Earth.
According to the U.S. Navy Joint Typhoon Warning Center, Typhoon Haiyan had maximum sustained winds of 195 mph (314 kilometers per hour), with gusts up to 235 mph (379 kilometers per hour) shortly before making landfall in the central Philippines today. That would make it one of the strongest storms ever recorded. Weather officials in the Philippines reported the storm, known locally as Typhoon Yolanda, came ashore with maximum sustained winds of 147 mph (235 kilometers per hour) and gusts of up to 170 mph (275 miles per hour).
The two AIRS images, acquired at 8:59 p.m. PST on Nov. 7 (left) and 9:17 a.m. PST on Nov. 8 (right), show the powerful storm in infrared. When the image on the left was acquired, the storm was located 214 miles (344 kilometers) south-southeast of Manila. By the time the image on the right was acquired, the fast-moving storm was already centered west of the Philippines, on a forecast track that will take it to Vietnam. The storm’s coldest cloud-top temperatures are indicated by the brightest shades of purple, and show where Haiyan’s heaviest rainfall was occurring.
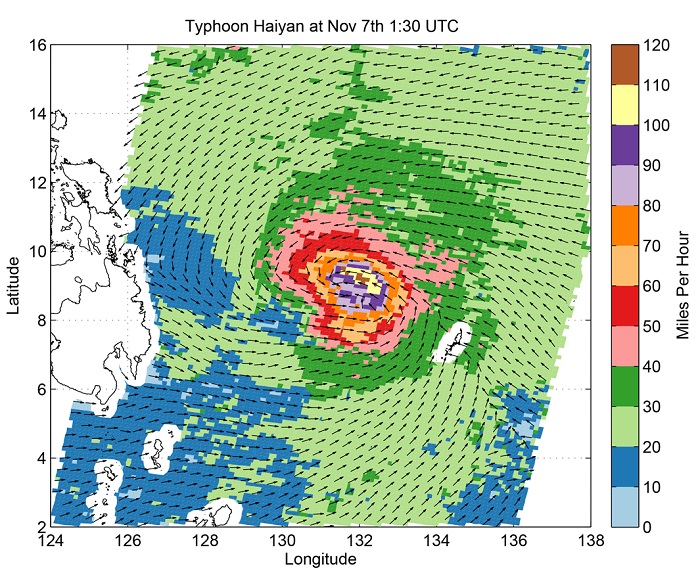
Another image, from the OSCAT radar scatterometer on the Indian Space Research Organization’s OceanSAT-2 satellite, shows Haiyan’s ocean surface winds at 5:30 p.m. PST on Nov. 6. The wind data were calculated by scientists at NASA's Jet Propulsion Laboratory, Pasadena, Calif., using an advanced wind retrieval algorithm designed for tropical cyclone conditions. The colors indicate wind speed and arrows indicate wind direction. The wind speeds were measured in 15-by-15-mile (24-by-24-kilometer) boxes that recorded a maximum value of 128 miles, or 206 kilometers, per hour). That’s why these wind speeds are lower than the maximum small-scale winds calculated by the U.S. Navy Joint Typhoon Warning Center.
.
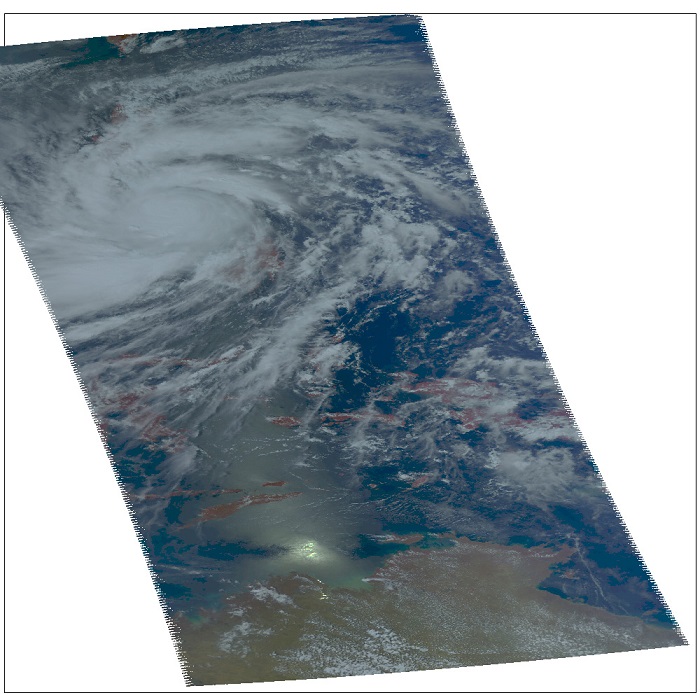
Visible image of Super Typhoon Haiyan acquired from NASA’s Atmospheric Infrared Sounder (AIRS) instrument on NASA’s Aqua spacecraft at 8:59 p.m. PST, Nov. 7.
Image Credit:
NASA/JPL-Caltech
.
Super Typhoon Haiyan’s ocean surface winds were measured by the OSCAT radar scatterometer on the Indian Space Research Organization’s OceanSAT-2 satellite at 5:30 p.m. PST on Nov. 6. The colors indicate wind speed and arrows indicate wind direction.
Image Credit:
ISRO/NASA/JPL-Caltech
.
Quelle: NASA
