
.
15.08.2015
ROSETTA’S BIG DAY IN THE SUN
You can also watch a replay of the Google+ Hangout with Rosetta mission experts that was broadcast on 13 August 2015.
ESA’s Rosetta today witnessed Comet 67P/Churyumov–Gerasimenko making its closest approach to the Sun. The exact moment of perihelion occurred at 02:03 GMT this morning when the comet came within 186 million km of the Sun.
.
Images of Comet 67P/C-G taken with OSIRIS narrow-angle camera on 12 August 2015, just a few hours before the comet reached perihelion, about 330 km from the comet. The individual images are also available below. Credits: ESA/Rosetta/MPS for OSIRIS Team MPS/UPD/LAM/IAA/SSO/INTA/UPM/DASP/IDA
In the year that has passed since Rosetta arrived, the comet has travelled some 750 million kilometres along its orbit towards the Sun, the increasing solar radiation heating up the nucleus and causing its frozen ices to escape as gas and stream out into space at an ever greater rate. These gases, and the dust particles that they drag along, build up the comet’s atmosphere – coma – and tail.
The activity reaches its peak intensity around perihelion and in the weeks that follow – and is clearly visible in the spectacular images returned by the spacecraft in the last months. One image taken by Rosetta’s navigation camera was acquired at 01:04 GMT, just an hour before the moment of perihelion, from a distance of around 327 km.
.
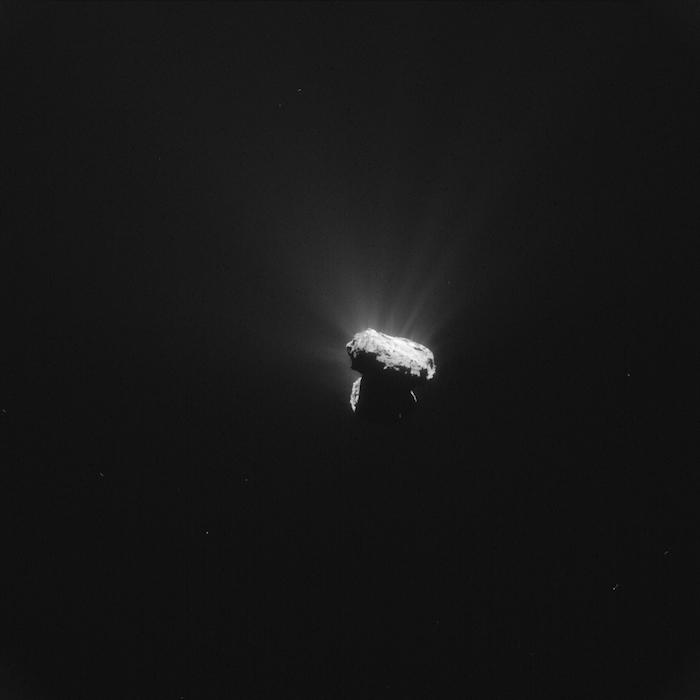
Single frame NAVCAM image of the comet at 01:04 GMT on 13 August 2015, just one hour before perihelion. The image was taken around 327 km from the comet. It has a resolution of 28 m/pixel, measures 28.6 km across and was processed to bring out the details of the comet's activity. Credits: ESA/Rosetta/NAVCAM – CC BY-SA IGO 3.0
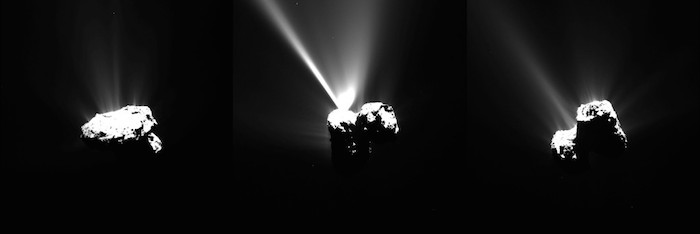
The scientific camera is also taking images today – the most recent available image was taken at 23:31 GMT on 12 August, just a few hours before perihelion. The comet’s activity is clearly seen in the images, with a multitude of jets stemming from the nucleus, including one outburst captured in an image taken at 17:35 GMT yesterday.
.
Sequence of OSIRIS narrow-angle camera images from 12 August 2015, just a few hours before the comet reached perihelion. Credits: ESA/Rosetta/MPS for OSIRIS Team MPS/UPD/LAM/IAA/SSO/INTA/UPM/DASP/IDA
“Activity will remain high like this for many weeks, and we’re certainly looking forward to seeing how many more jets and outburst events we catch in the act, as we have already witnessed in the last few weeks,” says Nicolas Altobelli, acting Rosetta project scientist.
.
The dust environment around the comet, providing a the challenging environment for the spacecraft to operate. Images captured on 6 July 2015 with the OSIRIS wide-angle camera. (Click through to see the full animated .gif). Credit: ESA/Rosetta/MPS for OSIRIS Team MPS/UPD/LAM/IAA/SSO/INTA/UPM/DASP/IDA
.
Rosetta’s measurements suggest the comet is spewing up to 300 kg of water vapour – roughly the equivalent of two bathtubs – every second. This is a thousand times more than was observed this time last year when Rosetta first approached the comet. Then, it recorded an outflow rate of just 300 g per second, equivalent to two small glasses of water.
Along with gas, the nucleus is also estimated to be shedding up to 1000 kg of dust per second, creating dangerous working conditions for Rosetta.
“In recent days, we have been forced to move even further away from the comet. We’re currently at a distance of between 325 km and 340 km this week, in a region where Rosetta’s startrackers can operate without being confused by excessive dust levels – without them working properly, Rosetta can’t position itself in space,” comments Sylvain Lodiot, ESA’s spacecraft operations manager.
.
Sequence of images showing a boulder-sized object close to the nucleus. They were taken with the OSIRIS narrow-angle camera on 30 July 2015. (Click through to see the full animated .gif). Credits: ESA/Rosetta/MPS for OSIRIS Team MPS/UPD/LAM/IAA/SSO/INTA/UPM/DASP/IDA
.
Monitoring the comet’s changing environment in the lead up to, during and after perihelion is one of the primary long-term science goals of the mission.
Over the last few months, seasons on the comet have changed, throwing its southern hemisphere into a short – about 10 month – summer after more than five-and-a-half years in darkness. This has revealed parts of the surface that have previously been cast in shadow during Rosetta’s sojourn at the comet, allowing scientists to fill in some of the missing pieces of its regional map.
They have now identified four new geological regions on the southern hemisphere, which includes parts of both comet lobes, bringing the total number of regions to 23. The names of the new regions follow the naming convention of Egyptian gods and goddesses adopted for the comet: Anhur, Khonsu, Sobek and Wosret.
.
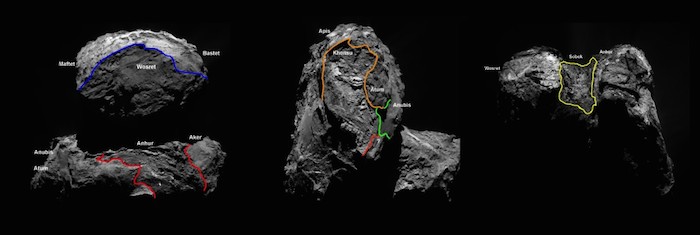
The new regions identified on the southern hemisphere of 67P/C-G. Credit: ESA/Rosetta/MPS for OSIRIS Team MPS/UPD/LAM/IAA/SSO/INTA/UPM/DASP/IDA
The comet’s average temperature has also been on the increase. Not long after arriving, surface temperatures of around –70ºC were recorded. By April–May 2015, this had risen to only a few degrees below zero celsius, and now highs of a few tens of degrees above zero are forecast for the next month.
Meanwhile, astronomers back on Earth have been following the comet’s evolution from afar. Rosetta is far too close to the comet to see its growing tail, but images collected over the past few months with telescopes across the world show that it already extends more than 120 000 km.
A lop-sided coma, with a notable high-density region away from the main tail, was revealed in various images, including some taken last week from the Gemini-North telescope on Mauna Kea, Hawaii.
.
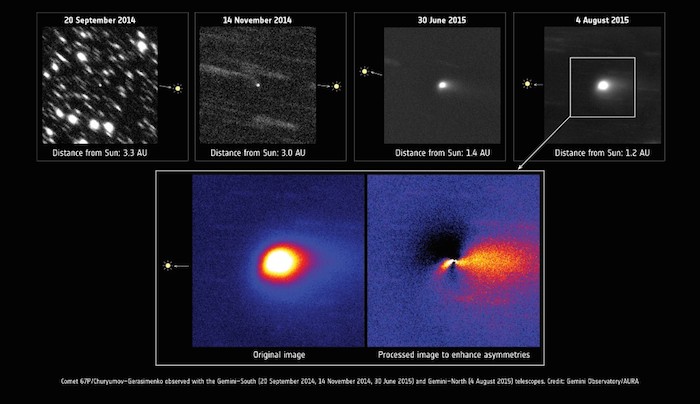
Ground-based images of the comet from the Gemini Observatory taken over the past year. The image taken on 4 August 2015, which is also showed in a zoomed and enhanced version below, reveals some asymmetries in the comet's tail. Credits: Gemini Observatory/AURA
.
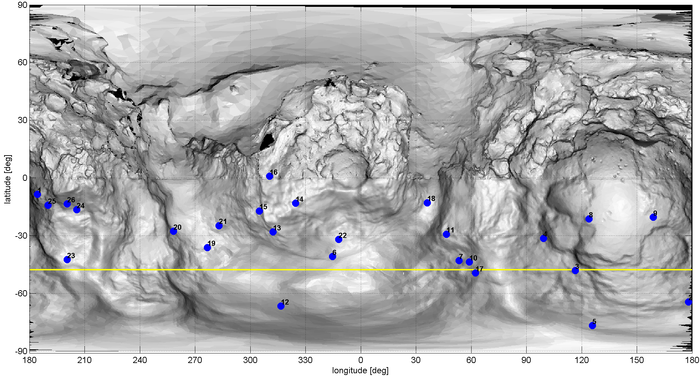
Projected map of Comet 67P/C-G based on OSIRIS data. The map uses a cylindrical projection, with the small lobe shown at the centre of the map and portions of the large lobe to the left and right. The blue points refer to possible origins, on the surface of the comet, of some of the dust jets recently observed by OSIRIS, while the yellow line indicates the sub-solar line. Credits: ESA/Rosetta/MPS for OSIRIS Team MPS/UPD/LAM/IAA/SSO/INTA/UPM/DASP/IDA
.
“Combining these big-picture views from ground-based telescopes with Rosetta’s close-up study of individual jets and outbursts will help us to understand the processes at work on the comet’s surface as it approaches the Sun,” adds Nicolas.
“We aim to go back in much closer again after the activity subsides and make a survey of how the comet has changed. We also continue to hope that Philae will be able to resume its scientific operations on the surface and give us a detailed look at changes which may be occurring immediately surrounding its landing site.”
Finally, Patrick Martin, ESA’s Rosetta mission manager remarks: “It’s exciting to reach the milestone of perihelion, and we look forward to seeing how this amazing comet behaves as we move away from the Sun with it over the coming year.”
.
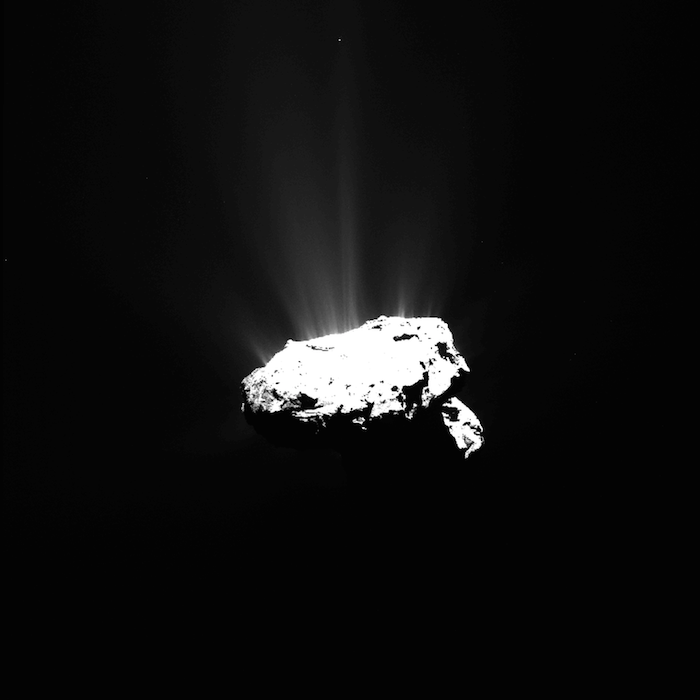
OSIRIS NAC image of Comet 67P/C-G taken on 12 August 2015 at 14:07 GMT. Credits: ESA/Rosetta/MPS for OSIRIS Team MPS/UPD/LAM/IAA/SSO/INTA/UPM/DASP/IDA
.
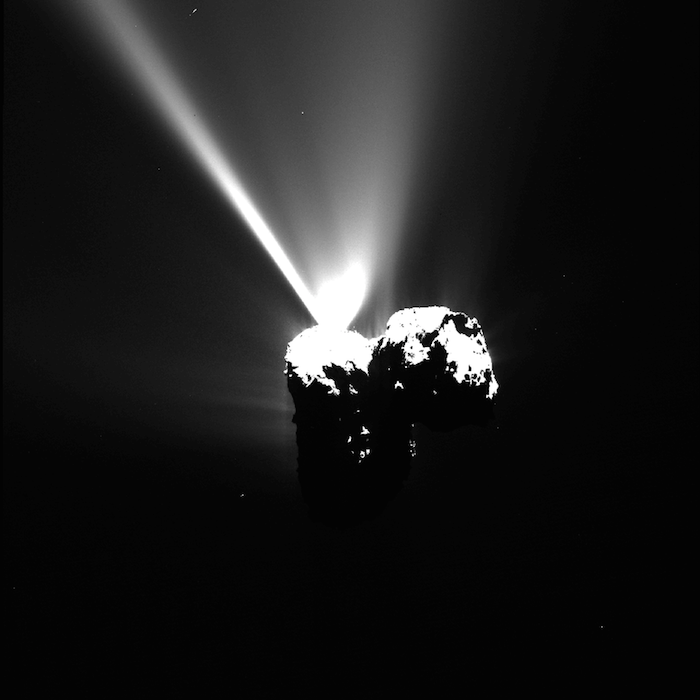
OSIRIS NAC image of Comet 67P/C-G taken on 12 August 2015 at 17:35 GMT. Credits: ESA/Rosetta/MPS for OSIRIS Team MPS/UPD/LAM/IAA/SSO/INTA/UPM/DASP/IDA
.
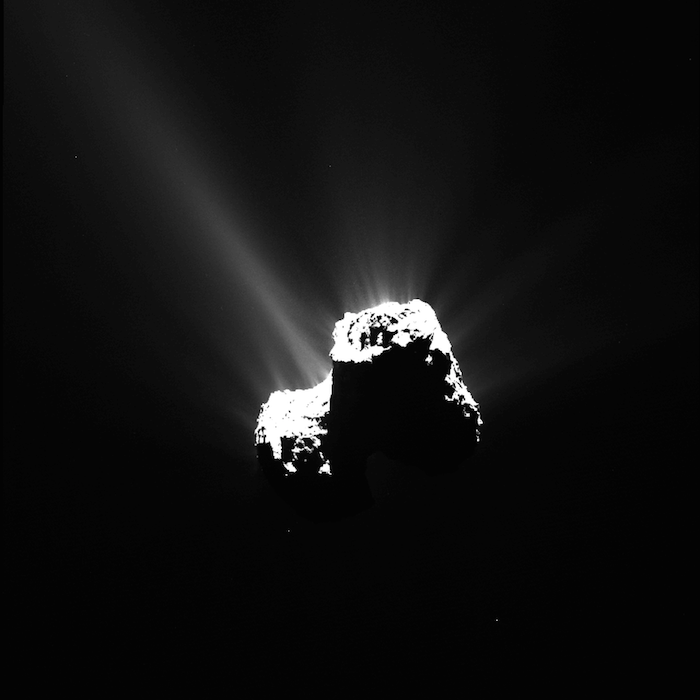
OSIRIS NAC image of Comet 67P/C-G taken on 12 August 2015 at 23:31 GMT. Credits: ESA/Rosetta/MPS for OSIRIS Team MPS/UPD/LAM/IAA/SSO/INTA/UPM/DASP/IDA
Quelle: ESA
.
Update: 18.08.2015
.
DO COMET FRACTURES DRIVE SURFACE EVOLUTION?
Extreme thermal stresses experienced by a comet as it orbits around the Sun could explain the extensive fracturing thought to drive its long-term surface erosion, say Rosetta scientists analysing high-resolution images of Comet 67P/Churyumov-Gerasimenko’s surface.
The study, which is published online in the journal Geophysical Research Letters, is based on images taken between 6 August 2014 – when Rosetta first arrived at the comet – and 1 March 2015, and includes detailed images acquired from between just 8 and 18 km from the comet’s surface.
Ramy’s team identified three distinct settings in which the fractures occur: networks of long narrow fractures, fractures on cliffs and fractured boulders. In addition, several unique features were identified: the parallel fractures running across Hathor’s 900 m-high cliffs, an isolated 500 metre-long crevice in the Anuket region of the comet’s neck, and a 200 m-long complex crack system in Aker on the large lobe.
“The fractures show a variety of morphologies and occur all over the surface and at all scales: they are found in the towering 900 m-high cliffs of Hathor right down to the surfaces of boulders a few metres across,” describes lead author M. Ramy El-Maarry from the University of Bern.
The most prevalent setting appears to be networks of narrow fractures that extend for a few metres to 250 m in length, typically on relatively flat surfaces. Interestingly, in some locations, the fractures appear to cross cut each other in polygonal patterns at angles of 90º – on Earth and Mars this is often an indicator of ice that has contracted below the surface.
.
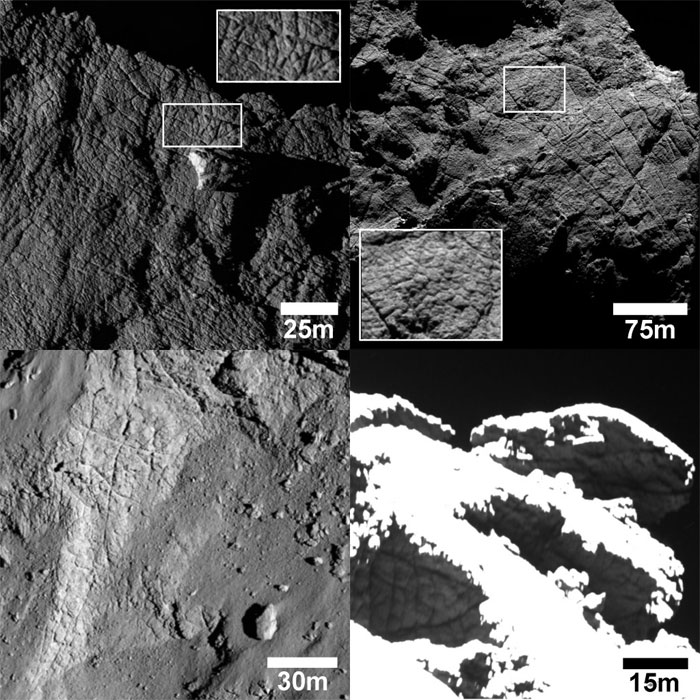
The variety of fracture networks found on Comet 67P/C-G, with an indication of physical scales. The top left image shows polygonal fractures on the edge of the Apis region, on the comet large box. The zoomed-in insert shows that the patterns are composed of irregular 2–5 meters-wide polygons. The top right image shows a pervasively fractured region at the edge of the Atum region, close to the comet's neck. Fractures vary greatly in length, with the longest visible one measuring about 250 m. Within this irregular pattern, a more regular pattern of 2–6 m-wide polygons is also visible, as shown in the insert. The bottom left image shows a regular patterns of fractures at the edge of the Nut region, a narrow, elongated depression on the small comet lobe. Patterns of 15 m-wide polygons with orthogonal fracture intersections are also visible. The bottom right image shows polygonal patterns on the edge the ridge separating the Anubis/Atum regions from Ash and Seth, on the large comet lobe The image has been overexposed to highlight the shadowed features, and smaller polygons with sizes of 2–5 m are also visible. A non-annotated version of the image is provided below. Credits: ESA/Rosetta/MPS for OSIRIS Team MPS/UPD/LAM/IAA/SSO/INTA/UPM/DASP/IDA
Another family of cross-cutting fractures is observed on cliff faces, such as in the Seth region on the comet’s large lobe, with debris deposits littering their bases. Fractured cliff faces were also observed at Abydos, the final landing site of Philae on the small lobe, as recorded in images from the lander. The fact that the fractures cut across each other in different directions suggests that the stress direction changes over time.
.
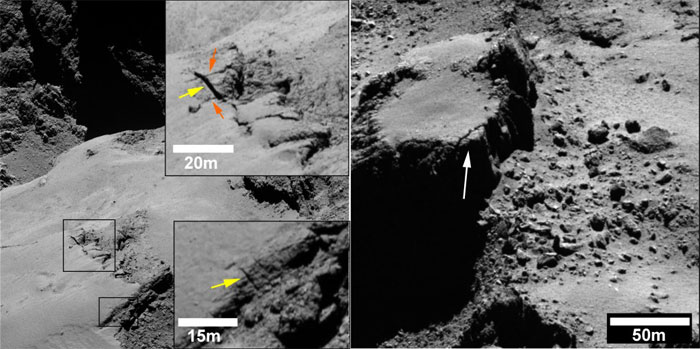
Fractures found on cliffs on Comet 67P/C-G. The large image on the left shows the Ash region (located on the large comet lobe) in the foreground and the regions of Hathor and Anuket (both on the comet's neck), in the background. The two boxes highlight two small portions of the comet surface, which are shown in greater detail in the two close-ups, with an indication of the physical scale. The top close-up shows a fractured scarp and what appears to be a new fracture (indicated with a yellow arrow) cross-cutting two older fractures (orange arrows). The new fracture is 100–125 cm-wide and is expected to lead to 'mass-wasting' of the fractured scarp. The bottom close-up shows another small fracture (indicated with a yellow arrow) that appears to cut though the scarp edge and the smooth coating on the top, which is a morphologic characteristic of the Ash region. The image on the right shows another portion of the Ash region exhibiting a similarly fractured scarp (indicated with a white arrow) and a debris field in at the foot of the cliff suggesting a progressive process of 'mass-wasting'. Non annotated versions of the individual images are provided below. Credits: ESA/Rosetta/MPS for OSIRIS Team MPS/UPD/LAM/IAA/SSO/INTA/UPM/DASP/IDA
At the smallest scale, fractures are observed on boulders (in this study, boulders 20-60 m wide were analysed). In some cases it is clear that the fractures run through the boulders, pervasively fracturing them, while other fractures appear confined to the boulder’s surfaces. Taken together, the fracturing points to an erosional sequence leading to the boulders’ eventual fragmentation.
.
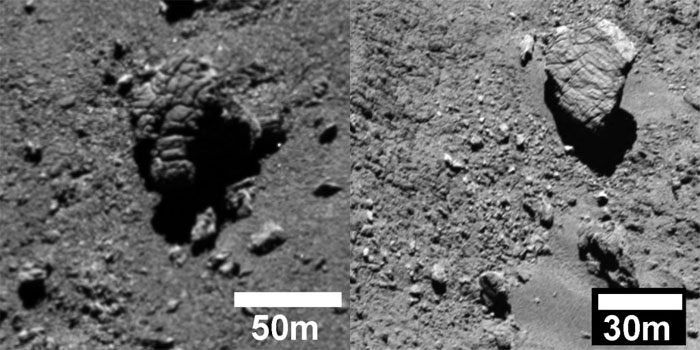
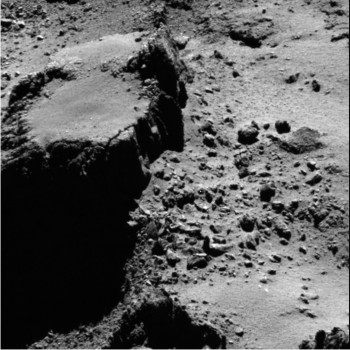
These two images show two fractured boulders found in the Imhotep (left) and Atum (right) regions, respectively. Fracturing in the Imhotep boulder is so pervasive it has led to fragmentation of the 60 m-wide boulder. An indication of the physical scale is provided; a non-annotated version of the image is available below. Credits: ESA/Rosetta/MPS for OSIRIS Team MPS/UPD/LAM/IAA/SSO/INTA/UPM/DASP/IDA
Scientists think that the majority of these fracture patterns are most likely linked to the thermal history of the comet and result from stresses that stretch the comet’s surface apart. On Earth and Mars at least, these ‘tensile’ fractures can develop through several common processes: loss of volatile materials, thermal contraction or contraction and expansion cycles, and tectonic processes.
In addition to throwing off volatile materials as they near the Sun, comets are known to undergo high fluctuations in surface and subsurface temperature on daily and seasonal timeframes. This continuous thermal ‘shock’ leads to weakening or “fatigue” of the surface both on the short term due to daily heating cycles, and on the long term as the seasons change along the comet’s 6.5 year orbit around the Sun.
.
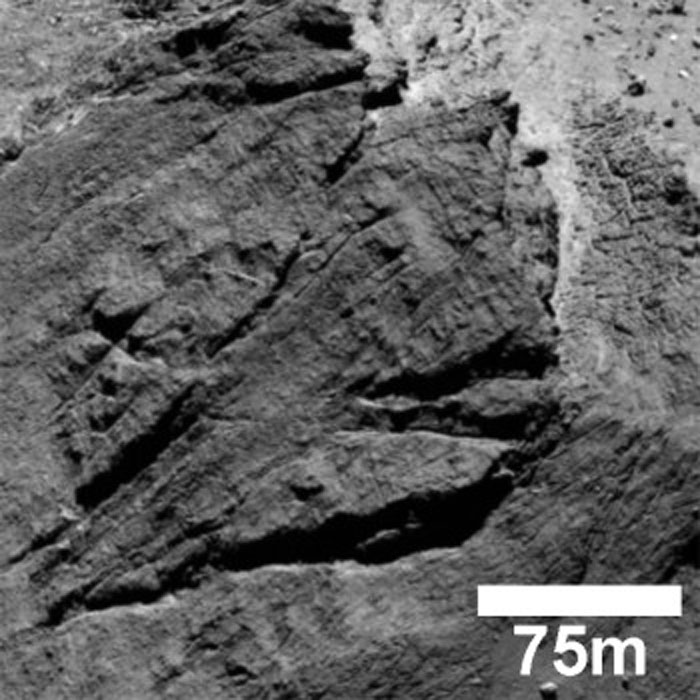
A 200-m complex fracture system in the Aker region, on the comet large lobe. This is an isolated feature in the context of the surrounding morphology. An indication of the physical scale is provided; a non-annotated version of the image is available below. Credits: ESA/Rosetta/MPS for OSIRIS Team MPS/UPD/LAM/IAA/SSO/INTA/UPM/DASP/IDA
.
“But the presence of fractures in different settings, in addition to the isolated fractures in Anuket and Aker, suggests that other mechanisms may also be at work,” comments Ramy. “For example, perhaps mechanical forces related to the comet’s rotation or orbit around the Sun are responsible for the crack in Anuket, while the fractured cliffs of Hathor could have resulted from the comet’s formation, perhaps when two smaller cometisimals collided.”
Regardless of the origin of individual fracture systems, it is clear that fracturing plays an important role in the evolution of the comet’s surface.
Fractures observed in cliffs, with debris observed at their bases, imply that this phenomenon represents the first stage in the overall ‘mass-wasting’ of the comet: the cliff top is weakened and a landslide-type event ensues.
But, over long periods this process would act to erode the surface and flatten the landscape. The fact that there are many rough terrains on the comet suggests that it has either not gone through very many erosional cycles or other processes are acting against this to roughen the surface, such as explosive jet activity.
“Monitoring for changes in these fracture systems after the current perihelion phase, and running models to simulate the evolution of the comet over time, will enable us to test our various hypotheses for fracture formation,” adds Ramy.
.
Quelle: ESA
4516 Views