.
Turning on new satellite instruments is like opening new eyes. This week, the Landsat Data Continuity Mission (LDCM) released its first images of Earth, collected at 1:40 p.m. EDT on March 18. The first image shows the meeting of the Great Plains with the Front Ranges of the Rocky Mountains in Wyoming and Colorado. The natural-color image shows the green coniferous forest of the mountains coming down to the dormant brown plains. The cities of Cheyenne, Fort Collins, Loveland, Longmont, Boulder and Denver string out from north to south. Popcorn clouds dot the plains while more complete cloud cover obscures the mountains.
.
.
.
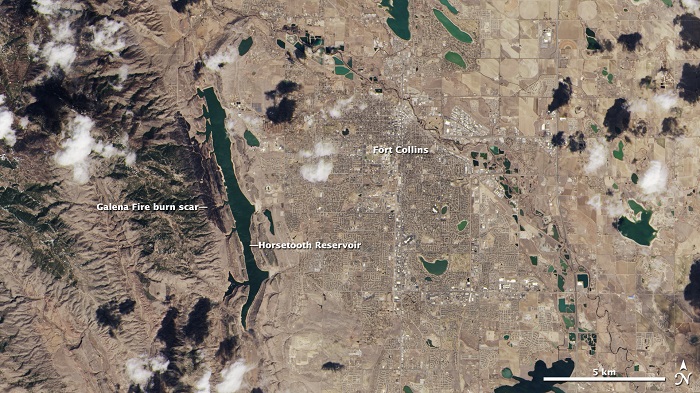
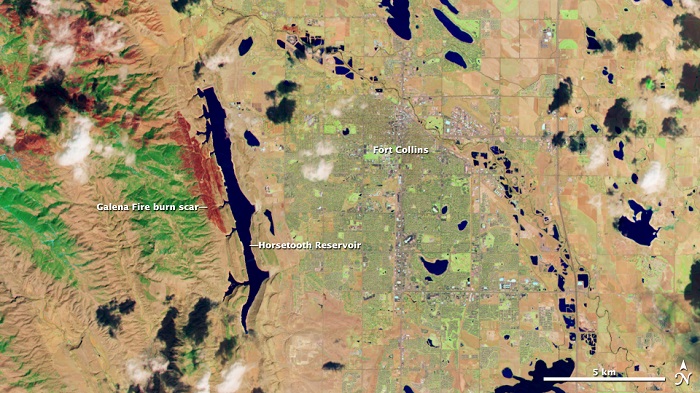
On the image is shown in natural color, created using data from OLI spectral bands 2 (blue), 3 (green), and 4 (red). The image on the right was created using data from OLI bands 3 (green), 5 (near infrared), and 7 (short wave infrared 2) displayed as blue, green and red, respectively. In the natural color image, the city's elongated Horsetooth Reservoir, a source of drinking water, lies west of the city. A dark wildfire burn scar from the Galena Fire is visible just to the left of the reservoir. The scar shows up bright, rusty red in the false color image.
.
LDCM is a joint mission of NASA and the Department of Interior's U.S. Geological Survey.
"It's a really great day," said Jeff Pedelty, an instrument scientist at NASA's Goddard Space Flight Center in Greenbelt, Md., who worked on the LDCM Operational Land Imager, or OLI instrument, that took the natural color image. He's very impressed with the level of detail they can see with the advancements to the sensor. "It's wonderful to see, there's no doubt about it, and it's a relief to know that this is going to work wonderfully in orbit."
The natural color image showed the landscape in the colors our eyes would see, but Landsat sensors also have the ability to see wavelengths of light that our eyes cannot see. LDCM sees eleven bands within the electromagnetic spectrum, the range of wavelengths of light. OLI collects light reflected from Earth's surface in nine of these bands. Wavelengths on the shorter side include the visible blue, green, and red bands. Wavelengths on the longer side include the near infrared and shortwave infrared.
LDCM's second instrument, the Thermal Infrared Sensor (TIRS) detects light emitted from the surface in two even longer wavelengths called the thermal infrared. The intensity of the emitted light at the longer wavelengths measured by TIRS is a function of surface temperature. In the black-and-white image of the first thermal band on TIRS, warmer areas on the surface are brighter while cooler areas are dark.
The first thermal images seen by Dennis Reuter, TIRS instrument scientist at Goddard, were forwarded to him from the data processors. "To say it was exciting was an understatement," said Reuter, who was blown away by the data quality. "Wow! This is beautiful!" he wrote in an email. "Look at those amazing clouds! And the detail!"
Clouds in the colder upper atmosphere stand out as black in stark contrast to a warmer ground surface background. The TIRS images were collected at exactly the same time and place as the OLI data, so all eleven bands can be used together.
.
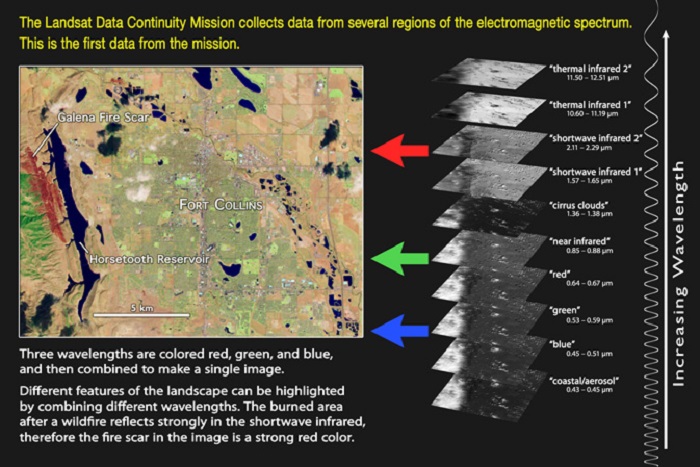
This diagram illustrates how LDCM's observations at different wavelengths are combined to create one image.
Credit: NASA's Goddard Space Flight Center
.
The infrared bands on both TIRS and OLI complement the visible bands, said Reuter. "You're seeing things in the visible that you don't necessarily see in the infrared, and vice versa," he said.
Different characteristics on the ground dictate the intensity of the reflection and emission of light in different bands from the surface, ultimately allowing scientists to distinguish between different surface features. To highlight differences across an image, analysts sometimes assign artificial colors to data from different spectral bands for display.
For example, zooming in to the area around Fort Collins, Colo., the natural color image was created from OLI bands 2 (blue), 3 (green), and 4 (red) data. In the image, a dark stripe can be seen just west of the Horsetooth Reservoir, a source of drinking water for the city. The stripe is a scar left in the aftermath of the Galena wildfire. That same burned area bursts out of the image as a bright, rusty red scar with greater contrast between the surrounding areas in the false color image. The false color image was created using data from OLI bands 3 (green), 5 (near infrared), and 7 (short wave infrared 2), assigned the colors blue, green and red respectively. These types of LDCM images and the accompanying data will be used by multi-agency Burned Area Emergency Response teams to plan and carry out wildfire recovery measures.
Similarly, the thermal bands that detect wavelengths dependent on surface temperature show more than just high altitude clouds. This ability to measure differences in temperature across the land surface is essential to one of the major applications of LDCM data: water management. Analysts in western states will use TIRS data in conjunction with OLI data to determine the amount of water being used in irrigated agricultural fields.
.
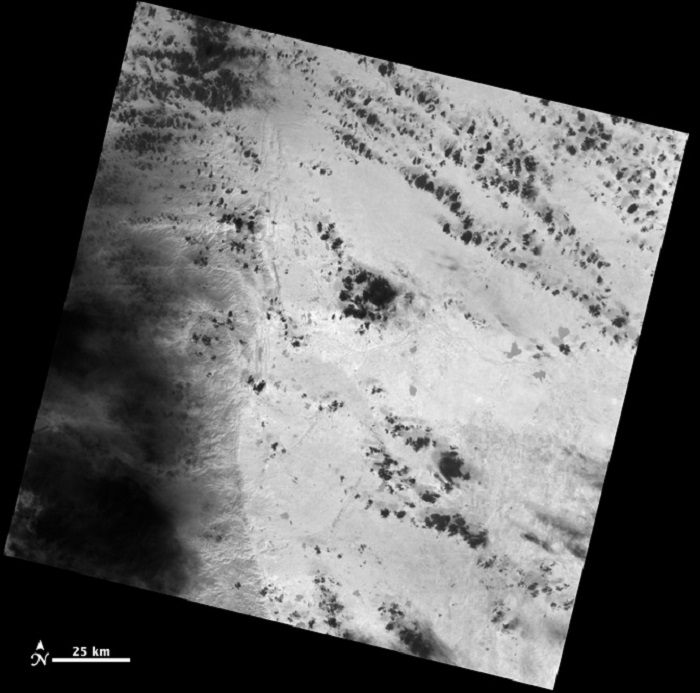
This black-and-white Landsat scene shows the area where the Great Plains meet the Front Range of the Rocky Mountains in Wyoming and Colorado. The image was created using data from the first TIRS thermal infrared band. Warmer surfaces appear light gray to white in the thermal image while cooler areas appear dark gray to black. Clouds in the colder upper atmosphere, for instance, appear black against the lighter background of the warmer ground surface. When the satellite begins normal operations, data products will contain co-registered (simultaneous) data for all of the OLI and TIRS.
Note to Landsat data users: This scene is slightly off set from the standard Path 33, Row 32 Landsat scene as LDCM has not yet reached its nominal 438-mile (705-kilometer) operational orbit.
.
"When you water plants they take it in through their roots and it comes up to their leaves, and if they have a plentiful water supply, they transpire," said Reuter. Transpiration, as well as evaporation from the soil, means that the water goes back into the atmosphere.
"It's just like when we sweat, we cool down. [Plants] cool down when they have a lot of water," said Reuter. "It's a beautiful illustration of the physics of radiative transfer and also the usefulness of the data." This application of LDCM data will be essential to the effective management of scarce water resources in our arid and semi-arid states.Both Reuter and Pedelty were impressed with the level of detail they see in the OLI and TIRS data. Part of that detail comes from the push broom design of both instruments. Instead of instruments that scan back and forth across a swath on the ground, push broom data collection looks across whole swath at once, allowing the sensors to observe each patch of ground longer.
"It's like taking a thermometer and letting it sit there longer to get a more stable measurement," said Reuter.
But the work is only beginning for validating the data quality and getting ready for normal mission operations. These images were processed using pre-launch settings, which must be checked and adjusted now that LDCM is in orbit to ensure that the data accurately measure the intensity of reflected and emitted light received by the instruments. The mission operations team also needs to ensure that each pixel is accurately located on Earth's surface.
Among the first activities planned in the next two months are reference checks for both OLI and TIRS. OLI will look indirectly at the sun with its solar diffuser panel.
"We let the sun shine on the panel so it makes a bright uniform target and we image that," said Pedelty, who adds that while it may seem mundane compared to an image of Earth, it's a key reference measurement for updating OLI's calibration.
In addition, for both OLI and TIRS calibration, LDCM will view deserts, the ocean and the moon, surfaces with relatively stable and well-known reflectance and emittance properties. The mission operations team also plans to fly underneath the currently orbiting Landsat 7 to collect data at the same time in order to cross-calibrate the two LDCM sensors with the Landsat 7 Enhanced Thematic Mapper-Plus (ETM+) instrument.
"Everything has been very exciting," said Reuter. These first images are the culmination of a lot of hard work from the people at NASA and USGS, the Landsat Science Team and their industry partners at Ball Aerospace Corp. in Boulder, Colo., that built OLI, and Orbital Science Corp. of Gilbert, Ariz., that built and tested the spacecraft, he said. "As a tool for science, for looking at the whole planet and seeing how we're affecting it, and how it's affecting us, it's gratifying in all ways."
Pedelty agrees. "I was privileged to work onsite at Ball Aerospace as they designed, built and tested the OLI. Then I moved to Orbital Sciences to help test the LDCM observatory. A lot of talented people worked very hard and everything had to work. And it has."
.
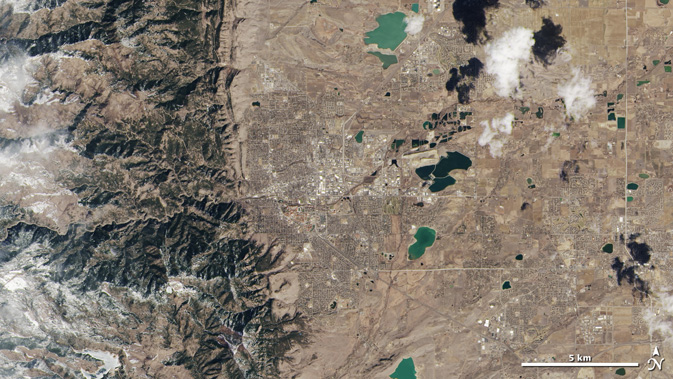
The area around Boulder, Colo., is shown here in a true color image collected by the OLI aboard LDCM on March 18, 2013. The OLI and an important component of TIRS, its cryocooler, were built at the Ball Aerospace & Technologies Corporation facility in Boulder.
Credit: USGS/NASA Earth Observatory
.
LDCM's normal operations are scheduled to begin in late May when the instruments have been calibrated and the spacecraft has been fully checked out. At that time, NASA will hand over control of the satellite to the USGS, which will operate the satellite throughout its planned five-year mission life. The satellite will be renamed Landsat 8, and data from OLI and TIRS will be processed and added to the Landsat Data Archive at the Earth Resources Observation and Science Center in South Dakota, where it will be distributed for free over the Internet.
Quelle: NASA
