.
Storm Head, Meet Tail
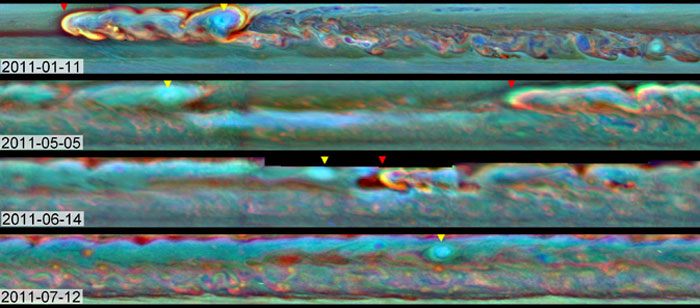
This set of images from NASA's Cassini mission shows the evolution of a massive thunder-and-lightning storm that circled all the way around Saturn and fizzled when it ran into its own tail. The storm was first detected on Dec. 5, 2010. That month, it developed a head of bright clouds quickly moving west and spawned a much slower-drifting clockwise-spinning vortex.
In the annotated images, the bright clouds at the head of the storm are indicated with a red triangle. A yellow triangle indicates the vortex.
The top image was taken on Jan. 22, 2011, shortly after the start of the storm, showing the bright head of the storm just ahead of the vortex by about 25,000 miles (40,000 kilometers). The second image shows that, on May 5, 2011, the head of the storm has traveled around the planet and started approaching the vortex from the east. The storm's body stretched 140,000 miles (224,000 kilometers), and the head was within about 51,000 miles (82,000 kilometers) of catching up to the vortex. This image also shows how quickly the vortex lost steam, shrinking and losing its bright clouds, compared to the still-raging head of the storm. By the third image, taken on June 14, 2011, the head of the storm had made its way almost entirely around the planet, about 183,000 (292,000 kilometers) miles ahead of the vortex in a westward direction, and it was about to catch up with the vortex. The head of the storm was just 8,700 miles (14,000 kilometers) to the east of the vortex at this time. The bottom image, from July 12, 2011, shows how the storm fizzled once the head and vortex collided. Only the vortex remains in that picture, while the bright cloud has disappeared. By late August, that band around Saturn stopped thundering and throwing lightning for good, though there continues to be turbulence in higher parts of the atmosphere.
Cassini's imaging science subsystem obtained these false color images. Here, the colors denote the altitudes of the clouds - with red being the lowest, green being an intermediate level and blue being the highest. White indicates thick clouds at a high altitude. Scientists assigned the red color channel to a wavelength of radiation that penetrates the atmosphere deep down to the top of the tropospheric cloud deck (750 nanometers). Green represents an intermediate wavelength above the troposphere (728 nanometers). Blue was assigned to a wavelength that penetrates only to the top of tropospheric haze (890 nanometers).
-
Call it a Saturnian version of the Ouroboros, the mythical serpent that bites its own tail. In a new paper that provides the most detail yet about the life and death of a monstrous thunder-and-lightning storm on Saturn, scientists from NASA's Cassini mission describe how the massive storm churned around the planet until it encountered its own tail and sputtered out. It is the first time scientists have observed a storm consume itself in this way anywhere in the solar system.
"This Saturn storm behaved like a terrestrial hurricane - but with a twist unique to Saturn," said Andrew Ingersoll, a Cassini imaging team member based at the California Institute of Technology, Pasadena, who is a co-author on the new paper in the journal Icarus. "Even the giant storms at Jupiter don't consume themselves like this, which goes to show that nature can play many awe-inspiring variations on a theme and surprise us again and again."
Earth's hurricanes feed off the energy of warm water and leave a cold-water wake. This storm in Saturn's northern hemisphere also feasted off warm "air" in the gas giant's atmosphere. The storm, first detected on Dec. 5, 2010, and tracked by Cassini's radio and plasma wave subsystem and imaging cameras, erupted around 33 degrees north latitude. Shortly after the bright, turbulent head of the storm emerged and started moving west, it spawned a clockwise-spinning vortex that drifted much more slowly. Within months, the storm wrapped around the planet at that latitude, stretching about 190,000 miles (300,000 kilometers) in circumference, thundering and throwing lightning along the way.
Terrestrial storms have never run into their own wakes - they encounter topographic features like mountains first and expend themselves. But Saturn has no land to stop its hurricanes. The bright, turbulent storm head was able to chomp all the way around the planet. It was only when the head of the storm ran into the vortex in June 2011 that the massive, convective storm faded away. Why the encounter would shut down the storm is still a mystery.
By Aug. 28, after 267 days, the Saturn storm stopped thundering for good. While Cassini's infrared detectors continue to track some lingering effects in higher layers of Saturn's atmosphere, the troposphere -- which is the weather-producing layer, lower in the atmosphere - has been quiet at that latitude.
"This thunder-and-lightning storm on Saturn was a beast," said Kunio Sayanagi, the paper's lead author and a Cassini imaging team associate at Hampton University in Virginia. "The storm maintained its intensity for an unusually long time. The storm head itself thrashed for 201 days, and its updraft erupted with an intensity that would have sucked out the entire volume of Earth's atmosphere in 150 days. And it also created the largest vortex ever observed in the troposphere of Saturn, expanding up to 7,500 miles [12,000 kilometers] across."
The vortex grew to be as large as the giant storm known as Oval BA on Jupiter. But Oval BA and Jupiter's more famous storm - the Great Red Spot - are not thunder-and-lightning storms. Jupiter's storms also have a quiet center, unlike the violence at the center of Saturn's storms.
"Cassini's stay in the Saturn system has enabled us to marvel at the power of this storm," said Scott Edgington, Cassini's deputy project scientist at NASA's Jet Propulsion Laboratory in Pasadena, Calif. "We had front-row seats to a wonderful adventure movie and got to watch the whole plot from start to finish. These kinds of data help scientists compare weather patterns around our solar system and learn what sustains and extinguishes them."
This storm was the longest running of the massive storms that appear to break out in Saturn's northern hemisphere once every Saturn year (30 Earth years). The longest storm of any size ever detected on Saturn actually unfolded over 334 days in 2009 in an area known as "Storm Alley" in the southern hemisphere, but it was about 100 times smaller in area than the latest northern storm.
-
First Chapter of the Northern Storm
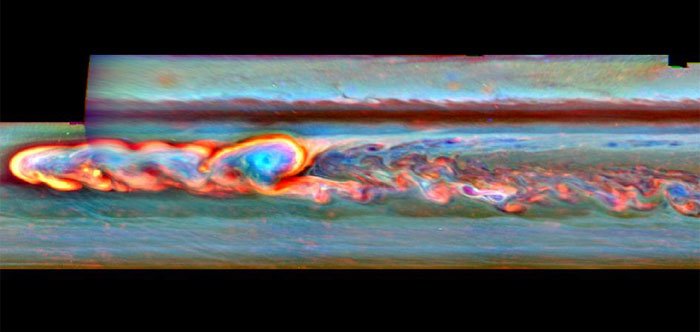
This mosaic of false-color images from NASA's Cassini spacecraft shows what a giant storm in Saturn's northern hemisphere looked like about a month after it began. The bright head of the storm is on the left. The storm also spawned a clockwise-spinning vortex, seen as the light blue circular feature framed with a curl of bright clouds a little to the right of the storm head.
Cassini's imaging camera obtained the images that went into this mosaic on Jan. 11, 2011. The storm erupted in early December 2010 and the head of the storm began moving rapidly westward. The vortex, spun off from the head of the storm in early December shortly after the storm began, drifted much more slowly. In August 2011, the head ran into the vortex, like a version of the mythical serpent that bites its own tail. By late August, the convective phase of the storm was over.
The colors indicate the altitudes of the clouds - red is the lowest, green is an intermediate level and blue is the highest. White indicates thick clouds at a high altitude. Scientists assigned red to a wavelength of radiation that penetrates the atmosphere deep down to the top of the tropospheric cloud deck (750 nanometers). The troposphere is the part of the atmosphere where weather occurs. They assigned green to the 728-nanometer wavelength. Blue is a wavelength band that penetrates only to the top of tropospheric haze (890 nanometer).
The Cassini-Huygens mission is a cooperative project of NASA, the European Space Agency and the Italian Space Agency. NASA's Jet Propulsion Laboratory, a division of the California Institute of Technology in Pasadena, manages the mission for NASA's Science Mission Directorate, Washington. The Cassini orbiter was designed, developed and assembled at JPL. The Cassini orbiter and its two onboard cameras were designed, developed and assembled at JPL. The imaging operations center is based at the Space Science Institute in Boulder, Colo.
-
Staring into the Vortex
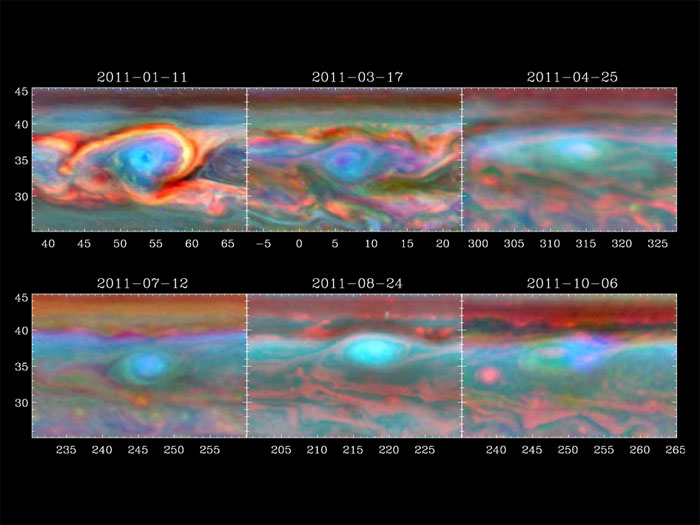
A vortex that was part of a giant storm on Saturn slowly dissipates over time in this set of false color images from NASA's Cassini spacecraft . This clockwise vortex spun off the bright head of the storm shortly after the thunder-and-lightning storm erupted in early December 2010.
The top left image shows the vortex's most turbulent activity captured by Cassini's imaging cameras on Jan. 11, 2011. It was centered around 54 degrees west longitude and 35 degrees north latitude. At the time, it was the largest vortex ever observed in Saturn's troposphere, which is the layer of the atmosphere where weather occurs. It measured up to 7,500 miles (12,000 kilometers) across. This is comparable in size to the giant storm on Jupiter known as Oval BA, though Oval BA and Jupiter's more famous storm – the Great Red Spot – are not thunder-and-lightning storms. Jupiter’s vortices are known for their stability and longevity. Precursors to Oval BA formed in the 1930s, and evolved into what finally became Oval BA in the late 1990s. The Great Red Spot has been in existence at least since 1879, and possibly since 1664. Jupiter and Saturn are similar in many respects. However, why Jupiter’s vortices are long-lived and why Saturnian ones are so short remain a mystery.
The image in the top middle was taken on March 17, 2011, when the center of the vortex had drifted west to around 6 degrees west longitude. The image on the top right was taken on April 25, 2011, when the vortex had moved to about 315 degrees west longitude.
The bright head of the storm was moving more quickly westward than the vortex and collided with the vortex by mid-June. The image at bottom left was obtained on July 12, 2011, after the head and vortex collided. The vortex here is less turbulent and is centered around 247 degrees west longitude. The bottom middle image was taken on Aug. 24, 2011, about four days before the storm's thunder and lightning ceased completely. The vortex is swirling at about 218 degrees west longitude. The bottom right image was taken on Oct. 6, 2011, when the vortex had nearly faded away. What is left of the vortex is centered around 248 degrees west longitude.
The colors in these images denote the altitudes of the clouds – with red being the lowest, green being an intermediate level and blue being the highest. White indicates thick clouds at a high altitude. Scientists assigned the red color channel to a wavelength of radiation that penetrates the atmosphere deep down to the top of the tropospheric cloud deck (750 nanometers). They assigned blue to a wavelength that penetrates only to the top of tropospheric haze (890 nanometers). Green represents an intermediate wavelength above the troposphere (728 nanometers).
-
Which Way the Wind Blows
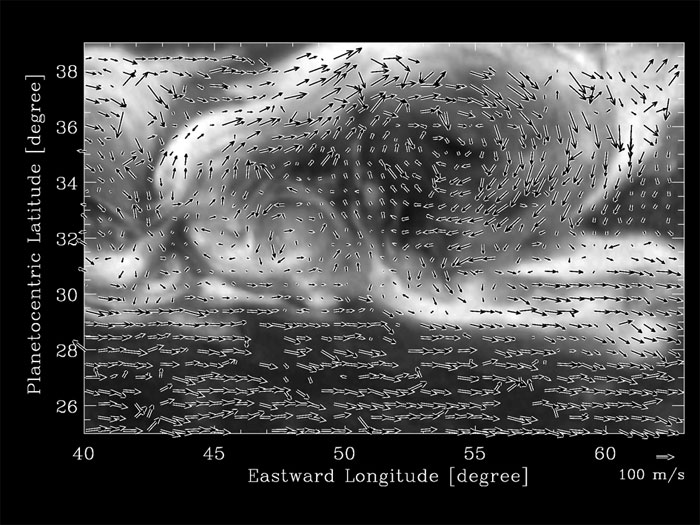
This image from NASA's Cassini spacecraft reveals the wind patterns within a large vortex that was spawned by a giant northern storm on Saturn. The arrows indicate the local direction of the winds. The vortex, a clockwise-spinning swirl, was spun off from the head of this storm in early December 2010, shortly after the storm erupted. The bright head of the storm moved swiftly in a westward direction around the planet, while this vortex drifted more slowly.
These data were obtained on Jan. 11, 2011.
-
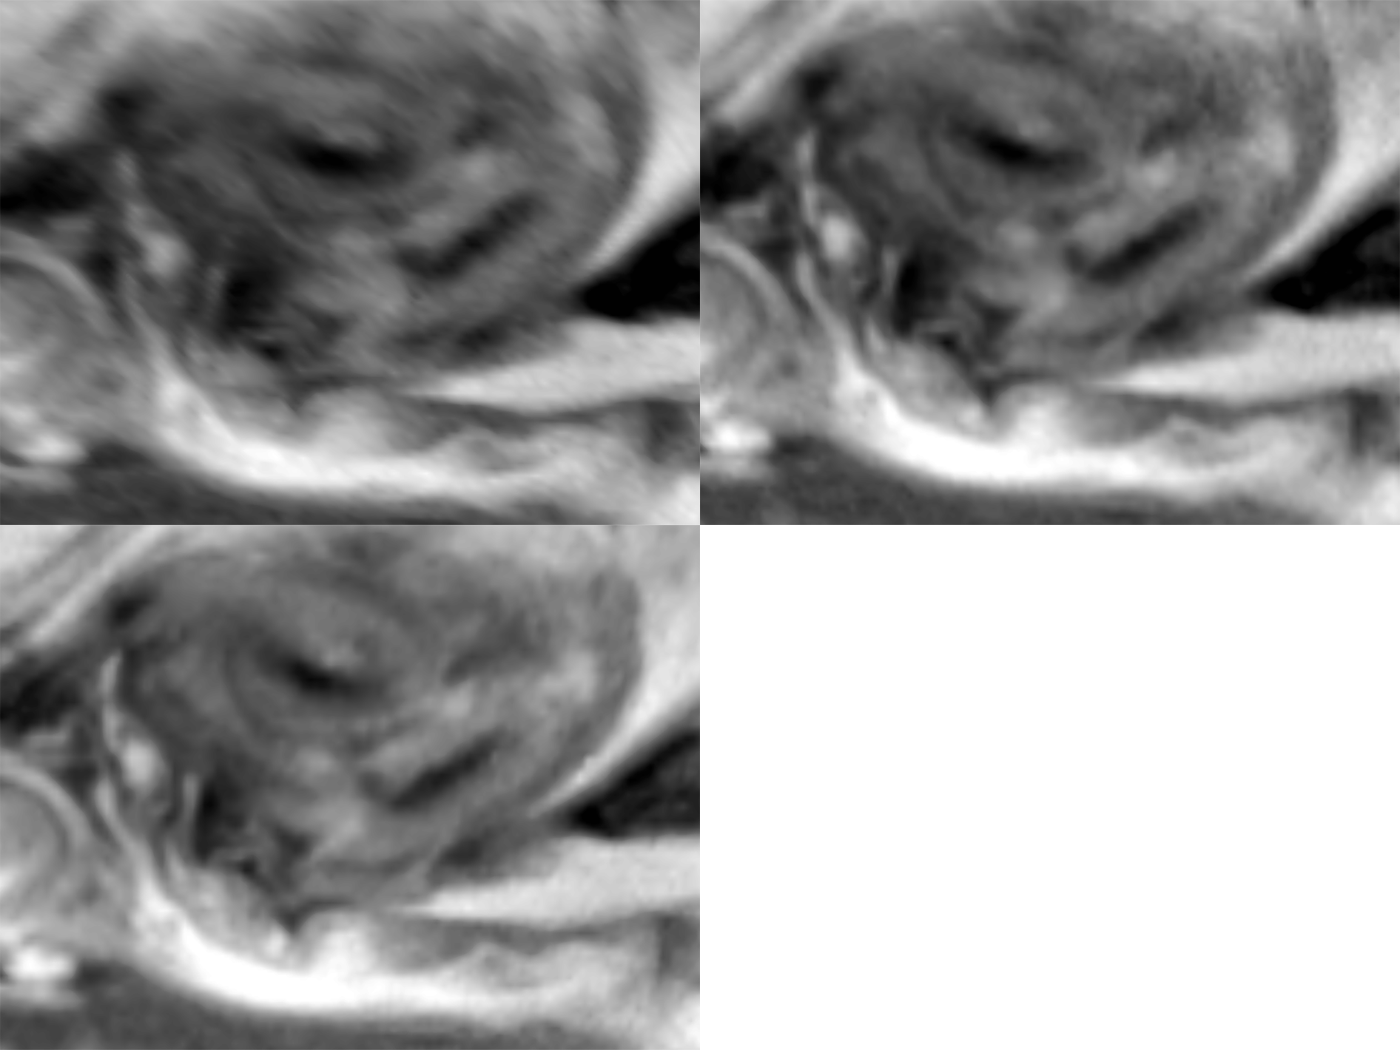
This three-frame animation from NASA's Cassini spacecraft shows the swirling clouds in a vortex spawned by a great northern storm on Saturn. Image credit: NASA/JPL-Caltech/SSI/Hampton University.
Quelle: NASA
5669 Views
