

.
![]()
For a low-lying, densely populated country like the Netherlands, monitoring subsidence is critical. Until recently, tiny displacements in the ground beneath our feet couldn’t be mapped nationally but, thanks to the Sentinel-1 mission, this is now possible.
Focusing on the Netherlands and Denmark, scientists have been using radar images from the Sentinel-1A satellite to pinpoint where the ground is stable, where it is rising and where it is sinking – and, importantly, by exactly how much.
Images from November 2014 to April 2016 and 2.5 million measurement points were used to compile the map above, which shows subsidence and uplift in the northeast of the Netherlands. Most of these measurements were made around buildings and constructions such as dikes.
Remarkably, these measurements are accurate to a few millimetres. However, within a couple of years this accuracy will improve further, approaching 1 mm/year over the entire country.
.
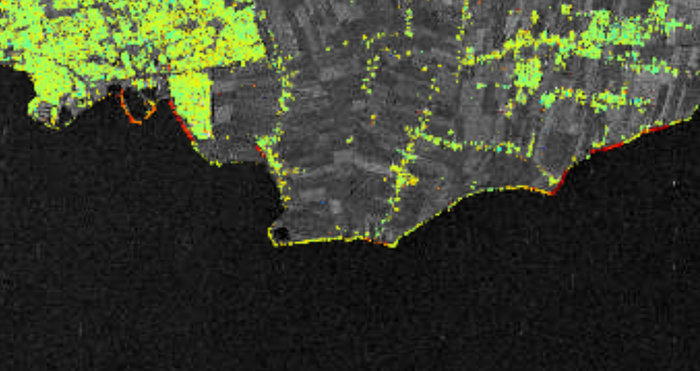
Sentinel-1A has been used to measure subsidence along the shores of the Markermeer in the Netherlands. This map, which is a zoom-in of a larger map, shows the area around the city of Hoorn. Areas where the ground is moving are shown in red, while green areas show where the ground is stable.
.
This degree of accuracy, which was not achievable over such a large area before Sentinel-1, is needed for numerous applications such as building and maintaining effective flood defences – an application particularly relevant for the Netherlands.
Ramon Hanssen from Delft University of Technology said, “For a nation largely sitting below sea level, surface deformation is of existential importance for the Netherlands.
“Satellite data from the Sentinel-1 mission helps us to monitor and maintain the high safety standards the Dutch population expects.”
The map at the top shows that some areas, particularly along the western shore of the Ijsselmeer, along the lower causeway that crosses this manmade lake, and some areas close to Groningen in the east, are sinking by as much as 20 mm a year.
Since gas is extracted in this region, monitoring ground deformation here is particularly important.
The zoom-in of the area around Veendam (right) shows subsidence thought to be caused by salt mining activities.
Marking the first milestone towards using Sentinel-1 to map ground movement nationwide, these results are thanks to a study carried out by PPO.labs and Norut though ESA’s Scientific Exploitation of Operational Missions initiative.
“From a technical point of view, these preliminary results clearly demonstrate the potential of such nationwide products. We now have to start preparing systems that can provide standardised products to end users,” said Yngvar Larsen from Norut.
There is huge potential for using standardised ground-deformation information for sectors such as insurance, utility services and construction.
Petar Marinkovic from PPO.labs said, “This unique capability, once a prerogative of larger companies, will now foster growth of small and medium enterprises in the Earth observation market.”
In Denmark, ground deformation affects the sewerage system as pipelines are compromised. As well causing leaky and broken pipes, changes in the surface also affect the way water accumulates and runs off. As a result, Denmark’s utility sector spends of tens of millions of euros every year to modify subsurface water and wastewater pipelines.
.
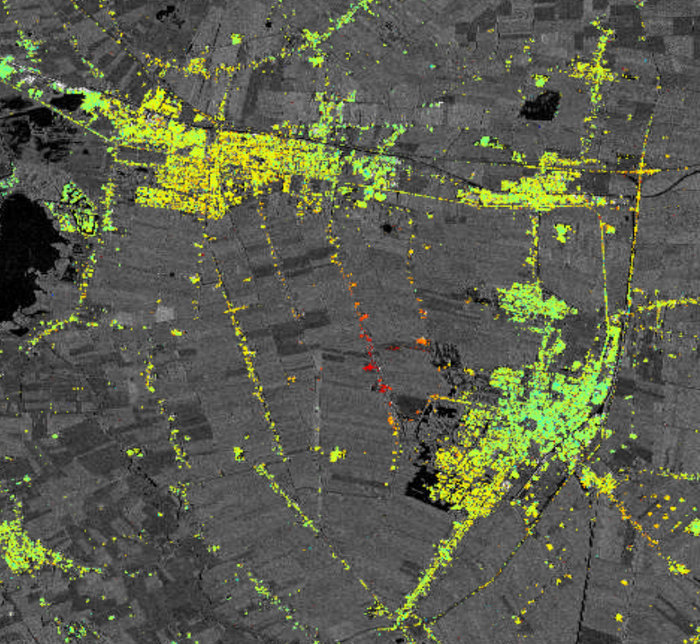
This shows surface deformation resulting from from salt mining activities around Veendam in the province of Groningen in northeast of the Netherlands. The map, which is a zoom-in of a larger map, has been generated using images from the Copernicus Sentinel-1A satellite. Green points show where the land is stable and the orange and red colours indicate subsidence.
.
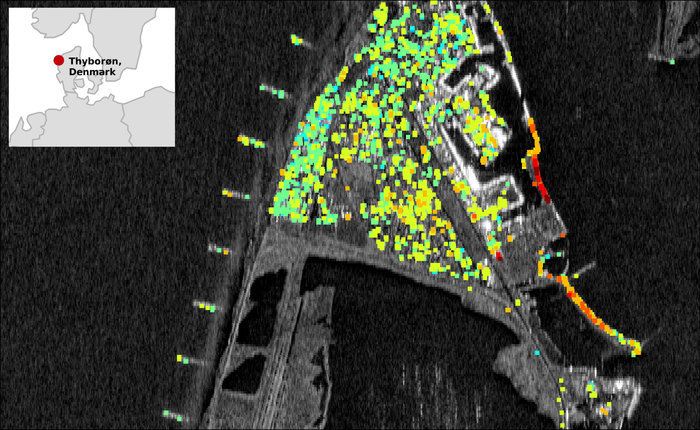
This map shows Thyborøn in Jutland, Denmark, where each coloured square is a measurement of the ground deformation. Green is stable, warmer colours indicate subsidence, and colder colours show uplift. A trend from stable in the west to subsidence in the east can be seen. This causes problems for wastewater pipes in the area. There is also a high rate of subsidence around the harbour. Sentinel-1A images from March 2015 to March 2016 were used to generate this map.
.
Understanding land deformation is important for investing in renovations.
Lars Noergaard Holmegaard, CEO of the Danish Lemvig Water and Waste Water Company, said, “If we can incorporate reliable information on land subsidence and uplift in our investment plans for the pipelines, we can focus the renovation activities where they are most needed and secure a functional network while reducing maintenance costs.”
Sentinel-1A, which has been in orbit since April 2014, is clearly paving the way for these new applications.
Moreover, now that its identical twin Sentinel-1B has also been launched, data delivery and coverage will be further improved. It is expected that the constellation will produce more than 10 terabytes of data per day.
“The open data policy and regular acquisition plan of the Copernicus programme allows research and development to be carried out at tremendous speed, providing results that can affect the world within a few hours after a satellite has gathered data,” noted Dr Marinkovic.
Quelle: ESA
4871 Views